Balancing the Need for a Transition to Sustainable Mobility with Equity Consideration
December 2025
Project Team
Project manager: Joe Delorto
Contributors: Tanner Bonner, Priyanka Chapekar, Annette Demchur, Rose McCarron, Rebecca Morgan, and Seth Strumwasser
The preparation of this document was supported by the Federal Highway Administration through MPO Planning and §5303 Contract # 126734. Central Transportation Planning Staff is directed by the Boston Region Metropolitan Planning Organization (MPO). The MPO is composed of state and regional agencies and authorities and local governments.
Central Transportation Planning Staff
Boston Region Metropolitan Planning Organization
State Transportation Building
Ten Park Plaza, Suite 2150
Boston, Massachusetts 02116
857.702.3700
ctps@ctps.org
This white paper presents the research, analysis, and findings of the Boston Region Metropolitan Planning Organization’s (MPO) study Roadway Pricing: Balancing the Need for a Transition to Sustainable Mobility with Equity Considerations. This study was funded through the MPO’s federal fiscal year (FFY) 2025 Unified Planning Work Program (UPWP) and is a continuation of a growing body of work by the MPO studying roadway pricing and its potential impact in the Boston region. The intended outcome of this study was to have a robust understanding of the data and tools available to the MPO for their suitability to support potential future analyses of roadway pricing options.
According to the INRIX 2024 Global Traffic Scorecard, the Boston region’s urban highway network is among the most congested in the country. A robust system of roadway pricing can help mitigate congestion, encourage mode shift to more sustainable travel modes, and generate revenue to fund transportation improvements. As the MPO continues to explore roadway pricing for the Boston region, this study seeks to evaluate data sources and analytical tools that could be used to support future analyses of potential roadway-pricing systems.
This study builds on previous efforts by the MPO to study roadway pricing and other transportation funding strategies, including prior UPWP studies and work with partner agencies. This study’s primary objective was to evaluate data and tools available to the MPO to better understand their suitability in estimating the potential magnitude of congestion reduction, revenue generation, and impacts to equity populations in the Boston region that may result from a system of roadway pricing.
The study began with a research and literature review, drawing on prior MPO work as well as peer agencies’ analyses of potential roadway pricing systems to inform the analysis. The next phase involved exploring available data sources and analytical tools and evaluating their ability to support a roadway pricing analysis. Early in the project, the MPO’s Congestion Management Process (CMP) Committee was consulted to provide feedback on the project approach and insight into what metrics were of interest. The feedback of the CMP Committee informed further development of the analysis approach and a conceptual roadway pricing scenario that would be useful to test out the data and tools. The study concluded with analyses of a conceptual roadway pricing scenario to assess how available data and tools could be applied to measure potential impacts on congestion, revenue, and equity in the region.
It is important to note that this study was conducted to evaluate data and tools rather than the hypothetical roadway pricing scenario selected for this study. This study’s analysis, results, and documentation are not intended as an endorsement or recommendation of any particular system or scenario of roadway pricing. The selected scenario is presented as a test case to assess the available data and potential methodologies for studying roadway pricing programs. Moreover, the study remains agnostic with respect to the legislative and political considerations associated with implementing such a system.
The Boston Region MPO has conducted previous research around roadway pricing, most notably in the FFY 2023 UPWP study Learning from Roadway Pricing Experiences. This study evaluated 13 existing roadway pricing systems across the United States, examining the programs’ creation, implementation, and lessons learned. The study examined cordon tolls, high-occupancy/toll lanes, express lanes, variable price tolling, targeted road user tolls, parking-pricing policies, and curb-management pricing, among other roadway pricing systems. Learning from Roadway Pricing Experiences identified key challenges and opportunities that influenced the current study, including
MPO staff evaluated potential congestion pricing revenue as part of the Massachusetts Bay Transportation Authority (MBTA) Sources of Community Value report published in 2024. This research developed an order-of-magnitude potential revenue estimate for a corridor-level congestion pricing system on controlled-access highways within Route 128. Staff estimated that this conceptual congestion pricing system could generate $440–880 million annually. The data sources and analysis conducted for MBTA Sources of Community Value—including the evaluation of different approaches to roadway pricing, analysis of regional highway traffic, and studying similar roadway-pricing systems throughout the country—helped inform the analysis and scenario selection process for this study.
MPO staff examined the existing research literature to learn more about the tools, data, and methodologies used by other agencies to evaluate roadway-pricing systems before implementation. The learnings from this research review process informed the tools, data, and metrics that MPO staff leveraged for the analysis in this study. The studies typically used regional travel demand models to help understand potential changes to travel patterns and INRIX congestion data to identify key areas where congestion mitigation is most needed. Common metrics included changes in vehicle travel, mode share, and the demographic characteristics of commuters to the zone.
MPO staff evaluated several sources related to the New York City Central Business District Tolling Program (CBDTP) to help inform the analysis for this study.
The federally required environmental assessment for the New York congestion pricing system was conducted using the region’s activity-based travel demand model. The analysis evaluated the projected impacts of congestion pricing across two study areas: a local study area, which consisted of New York City proper plus Bergen, Essex, Hudson, and Union counties in New Jersey; and a regional study area, which covered the entire model region including Long Island and other parts of New York, New Jersey, and Connecticut.
The environmental assessment considered many different potential equity impacts across the study areas, including traffic diversions around the congestion zone, population characteristics of the study areas, regional travel characteristics (such as demographics of commuters, household vehicle availability, and mode share of commute trips), an air quality analysis, and capacity impacts to the regional transit network. The analysis also estimated vehicle-miles traveled (VMT) changes in environmental justice (EJ) communities as compared to non-EJ communities.
The assessment estimated that the CBDTP would reduce daily VMT by five percent, daily vehicles by 15 percent, and generate more than $1 billion annually in revenue for the Metropolitan Transit Authority. The assessment also identified several mitigations and project enhancements to address potential inequities for taxi operators and low-income drivers.
In August 2024, Replica, a data fusion platform that generates synthetic regional travel behavior data, published an analysis of the New York congestion pricing zone that aimed to quantify the demographics and travel behavior of commuters to the congestion zone before congestion pricing went into effect. The study estimated how many people commute to the CBDTP cordon area from each census tract in the region, what percentage of total commuters from each tract this represents, and how many of these commuters drive versus taking public transit.
Replica’s analysis suggested that commuters to the congestion zone are more likely to come from New York City proper than suburban counties. In addition, a vast majority of commuters into the CBDTP zone, more than 80 percent, take transit daily. Replica reported that, on average, auto commuters into the zone are wealthier and less diverse than those who take transit.
In 2010, the San Francisco County Transportation Authority released a study of several potential cordon-style congestion pricing systems for downtown San Francisco, California. The study team evaluated several scenarios, which were developed through an iterative process and focused on mitigating congestion and identifying areas with the most robust alternatives for driving trips.
The Mobility, Access, and Pricing study evaluated a suite of metrics including VMT, peak-period travel times, transit ridership, daily trips and mode share, air quality impacts, and the operating expenses and revenue of each system. The study concluded that a cordon-type roadway-pricing system would be effective in reducing VMT and greenhouse gas emissions, reducing peak-period vehicle trips to the downtown area by 15 percent, while also fostering sustainable economic growth. While this type of detailed, iterative scenario analysis was not within the scope for this study, the San Francisco study was useful for identifying key metrics, criteria for selecting a cordon zone, and areas of future analysis and research.
The Southern California Association of Governments (SCAG), the MPO for the greater Los Angeles region, released a study in 2019 that studied the potential impacts of a congestion pricing zone in Los Angeles and Santa Monica, California. In screening the initial alternatives for the potential congestion zone, the study team prioritized reducing congestion, maximizing positive financial and economic outcomes, and selecting a zone that was “institutionally, technologically, and socially implementable.”
The Go Zone and Pricing Feasibility Study identified person-hours of congestion reduction, the monetary value of time saved, and reduction in VMT as priority performance metrics for the congestion pricing system. The study also evaluated air quality impacts, identified ways to minimize the capital and operating costs of the system, and conducted a robust economic analysis of impacts of reduced congestion. SCAG projected that the proposed congestion pricing zone would cause a slight reduction in auto trips, congestion, and greenhouse gas emissions, while generating sufficient revenue to pay for the program and further environmental and transit investments.
To understand the strengths and limitations of the available data and tools, MPO staff first developed a roadway-pricing scenario on which to perform a conceptual analysis. This scenario is not intended as a formal proposal for a roadway-pricing system, and the results of the analysis are not a complete assessment of the impacts of roadway pricing in the region. The conceptual scenario and analysis provide an opportunity to apply and evaluate the available data and tools.
Three roadway-pricing strategies identified in the MPO’s prior study, Learning from Roadway Pricing Experiences, were considered as potential approaches for this study.
Cordon pricing, commonly referred to as “congestion pricing,” involves pricing auto travel on local roadways within a designated boundary. This boundary usually encompasses a city’s downtown area or central business district, where roadways are most congested and alternative travel options are the most plentiful. Cordon pricing has been implemented in Stockholm, Singapore, Milan, London, and New York City. Each of these cities has unique prices, exceptions, and technologies that differentiate their systems, but the general approach is similar across all five.
Under a corridor pricing system, individual roadway facilities (usually controlled-access highways) are tolled to reduce congestion. These tolls may dynamically respond to vehicle volumes to maintain a designated free-flow speed. Examples of corridor-pricing systems include express lanes, which provide a lower-congestion alternative to non-priced highway lanes along the same corridor, or high-occupancy/toll lanes, which are available to high-occupancy vehicles at no fee and single-occupancy vehicles for a toll. Corridor pricing is much more widely used across the United States than cordon pricing and has been deployed in regions such as San Francisco, San Diego, Washington, DC, and Atlanta, among others. MPO staff previously conducted a high-level analysis of corridor-level congestion pricing for the MBTA Sources of Community Value study, evaluating the potential for revenue generation if the region’s major highway facilities were tolled.
Under a parking-pricing strategy, on-street parking facilities in a designated area are dynamically priced to encourage parking turnover, changing travel to off-peak times, or shifting to non-auto modes. The most prominent example of this strategy in the United States was Washington, DC’s Chinatown/Penn Quarter Parking Pricing Pilot Program, which involved the deployment of streetside vehicle detection equipment to determine parking occupancy and dynamically adjust parking rates. Although the strategy was not selected for this study, largely due to a lack of available data to fully understand parking behavior in the region, evaluating how parking pricing and policy can complement a system of roadway pricing to encourage more sustainable travel in the region remains an important topic for future study.
At the MPO’s CMP Committee on June 12, 2025, this study was introduced, and feedback was solicited on preferred scenario alternatives and metrics to be analyzed. Committee members generally expressed interest in analyzing cordon or corridor pricing (with a preference for cordon pricing given the novelty of the analysis for the Boston region) and identified several metrics of interest in evaluating a roadway pricing system. These included identifying auto trips with a viable transit alternative, impacts to transit travel times, and the demographics of roadway and transit users who would be impacted by a congestion charge. Committee members also emphasized that any potential cordon area should include viable transit alternatives to driving to maximize mode shift.
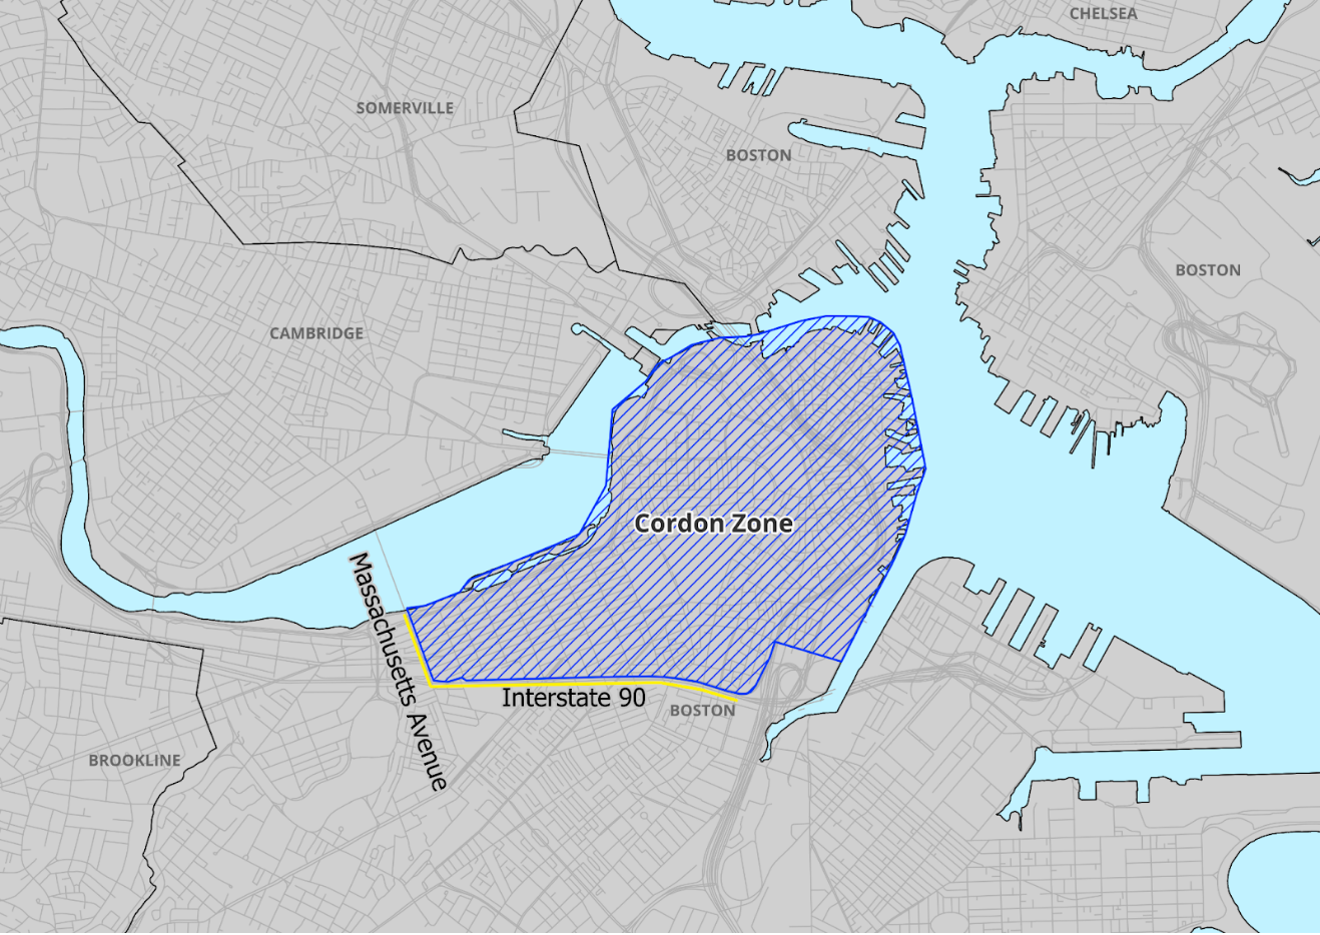
Following engagement with the CMP Committee and consideration of available data, a hypothetical cordon pricing system in the Boston region was identified as a test case scenario to test the data and tools. To develop a cordon area, staff prioritized areas with high vehicle volumes and traffic congestion, a large number of trip destinations, and viable transit alternatives to driving. An area of Boston that generally includes the Downtown and Back Bay neighborhoods best met these criteria. The conceptual cordon zone analyzed for this study is generally bounded by the Charles River, Boston Harbor, Fort Point Channel, Interstate 90 (I-90), and Massachusetts Avenue. The hypothetical cordon zone is illustrated below in Figure 1, with the major boundary roadways highlighted in yellow.
Figure 1
Hypothetical Cordon Zone Scenario
Source: Boston Region MPO staff.
For the purposes of this analysis, only auto and truck traffic on the local street network within this zone was subject to a congestion charge. Pass-through traffic on controlled-access highways in the zone (including I-90, Interstate 93 [I-93], and the Sumner and Callahan tunnels) that did not use the local street network in the zone was not charged.
MPO staff explored several data sources and analytical tools that could potentially support a roadway pricing analysis. This section describes each of these resources, details their use in this study, and presents sample insights from each.
Replica is a data fusion platform that converts a variety of data sources to an activity-based travel demand structure to provide synthetic regional travel behavior data for a typical Thursday or Saturday. Replica’s outputs are based on various data sources including observed vehicle volumes, transit ridership, economic activity data, connected vehicle data, and cell phone-based location data. The Replica platform is available to subscribed institutions through the Replica website or a cloud database accessed through Google BigQuery. MPO staff used Replica to estimate the demographics and travel behavior of those who would be impacted by the conceptual scenario selected for this study.
Replica can be used to estimate the demographics and travel behavior of those who would be affected by a roadway-pricing scenario. The goal of this type of analysis is to examine who is currently driving into a cordon area and would thus be directly affected by a congestion charge. Furthermore, demographics of trips that originate near transit can be analyzed to help understand who has a viable transit alternative for trips to the cordon area and how many of these trips are already using transit.
For the hypothetical cordon area, Replica data was analyzed for a typical Thursday from fall of 2024. Two sets of trips were analyzed: (1) all trips that use local roadways within the cordon area and (2) the subset of those trips that also originate near a transit station. The latter are defined as trips originating within one-half mile of rail rapid transit stations or within one mile of commuter rail or ferry stations. For each of these sets of trips, the following metrics were calculated:
Table 1 shows the relative shares of trips through the hypothetical cordon area by mode for different demographic groups.
Table 1
Sample Results: Share of Daily Trips to the Hypothetical Cordon Area, by Mode and Demographic Group
Mode |
Minority |
Non-minority |
Low-income |
Non-low-income |
Non-English-speaking |
English-speaking |
Age 75 or older |
Under age 75 |
Driving |
33% |
67% |
16% |
84% |
38% |
62% |
4% |
96% |
Transit |
46% |
54% |
15% |
85% |
50% |
50% |
1% |
99% |
Walk/bike |
33% |
67% |
26% |
74% |
57% |
43% |
3% |
97% |
All trips |
34% |
66% |
18% |
82% |
40% |
60% |
4% |
96% |
MPO pop. |
37% |
63% |
19% |
81% |
29% |
71% |
7% |
93% |
MPO = metropolitan planning organization. pop. = population.
Source: Replica data, 2020 Decennial Census, and 2019–23 American Community Survey five-year estimates.
In the hypothetical cordon area, the demographics of estimated trips within the zone generally match the demographics of the entire region, except trip takers from non-English-speaking households. Relative to their share of the regional population, trip takers from these households make up a higher proportion of estimated trips to the cordon. Similarly, estimated transit trips to the cordon area have a higher proportion of people belonging to a racial minority than the regional population. This analysis estimates that people driving to the cordon area are slightly wealthier and more likely to be nonminority than the regional population.
Replica can also estimate origin-destination flows for trips originating near transit stations, which gives the opportunity to evaluate the demographics of regional residents who have a viable transit alternative to auto travel. Table 2 shows the relative shares, by mode and demographic groups, of trips to the hypothetical cordon area that originate within a one-half mile of a rapid transit station or one mile of a commuter rail or ferry station.
Table 2
Sample Results: Share of Daily Trips to the Hypothetical Cordon Area Originating Near Rail/Ferry Transit, by Mode and Demographic Group
Mode |
Minority |
Non-minority |
Low-income |
Non-low-income |
Non-English-speaking |
English-speaking |
Age 75 or older |
Under age 75 |
Driving |
38% |
62% |
17% |
83% |
41% |
59% |
4% |
96% |
Transit |
49% |
51% |
15% |
85% |
47% |
53% |
1% |
99% |
Walk/bike |
35% |
65% |
25% |
75% |
45% |
55% |
3% |
97% |
All trips |
39% |
61% |
19% |
81% |
44% |
56% |
3% |
97% |
MPO pop. |
37% |
63% |
19% |
81% |
29% |
71% |
7% |
93% |
MPO = metropolitan planning organization. pop. = population.
Source: Replica data, 2020 Decennial Census, and 2019–23 American Community Survey five-year estimates.
The modeled demographics of trip takers to the hypothetical cordon area whose trips originate near rail and ferry transit stations are also similar to the regional population, again except for trip takers’ household language. People who speak a language other than English at home make up a larger portion of these estimated trips than they do of the regional population (though the difference for trips originating near transit is smaller than that for all trips to the zone). Furthermore, trip takers that originate near a rail or ferry station are more likely to belong to a racial minority compared to all people taking trips through the cordon area.
Table 3 shows the share of all trips through the hypothetical cordon area by distance.
Table 3
Sample Results: Daily Trips To the Hypothetical Cordon Area, by Mode and Trip Distance
Distance |
Total trips |
Share of all trips |
Share of driving trips |
Share of transit trips |
Share of walking and biking trips |
Less than 1 mile |
153,671 |
13% |
3% |
2% |
58% |
1–1.99 miles |
91,981 |
8% |
5% |
6% |
22% |
2–4.99 miles |
206,272 |
18% |
16% |
33% |
16% |
5–9.99 miles |
270,127 |
23% |
27% |
37% |
4% |
10–49.99 miles |
372,739 |
32% |
41% |
21% |
1% |
50 or more miles |
67,476 |
6% |
8% |
0% |
0% |
Total trips |
1,162,266 |
1,162,266 |
844,767 |
102,183 |
215,316 |
Source: Replica data.
Trips with a destination in the hypothetical cordon area have a median distance of approximately seven miles. One-third of all trips to the area are more than 10 miles long and only approximately one-fifth are less than two miles long.
The estimated distribution of trip distances by mode indicates that most people driving come from areas that are fairly far from the cordon area, with more than 75 percent of driving trips (642,000 trips) covering five miles or more, while only 24 percent (203,000 trips) are shorter than five miles. Estimated transit trips are evenly distributed between two and 50 miles, with very few trips shorter than two miles. Unsurprisingly, trips taken by people walking and biking are generally shorter; almost all of them are less than five miles.
Conveyal is an online platform that analyzes regional access to destinations under different land use and transportation scenarios. Conveyal measures access using a sophisticated, multimodal routing engine that evaluates whether people can reach a destination in a given travel time. Conveyal can be used to evaluate transit access to a cordon zone area. Conveyal can also be used to assess which parts of the region would be able to most easily reach the cordon zone using existing transit alternatives and compare the demographic characteristics of those who would and would not be able to access the cordon zone.
Conveyal can be used to evaluate where people are able to access a cordon area within a 30- and 45-minute transit trip. For the hypothetical cordon zone, the Conveyal analysis was run for the AM Peak (6:30–9:30 AM) time period. Access was evaluated at a 250-meter resolution; higher-resolution analyses are possible but require more computing time.
A map of areas with access to the hypothetical cordon area within a 30-minute transit trip during the AM Peak time period is shown in Figure 2. A similar map is shown for a 45-minute transit trip in Figure 3. Areas with access to the zone within the given time band are lightly shaded, while areas without are darkly shaded.
Figure 2
Sample Results: Areas with Access to Hypothetical Cordon Zone Within a 30-Minute Transit Trip (AM Peak)
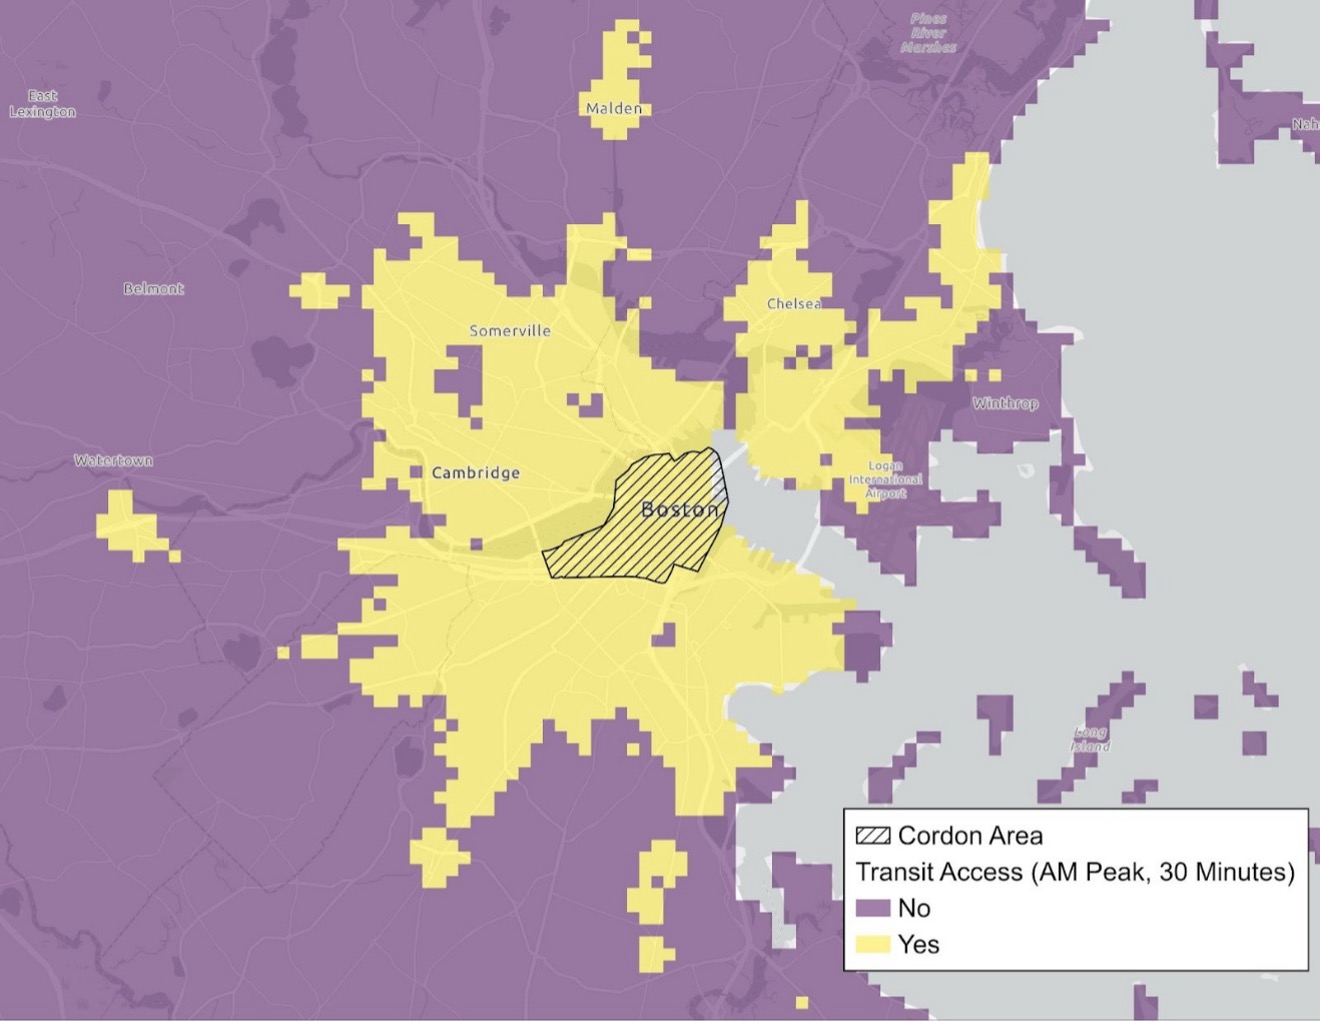
Source: Boston Region MPO staff and Conveyal data.
Figure 3
Sample Results: Areas with Access to Hypothetical Cordon Zone Within a 45-Minute Transit Trip (AM Peak)
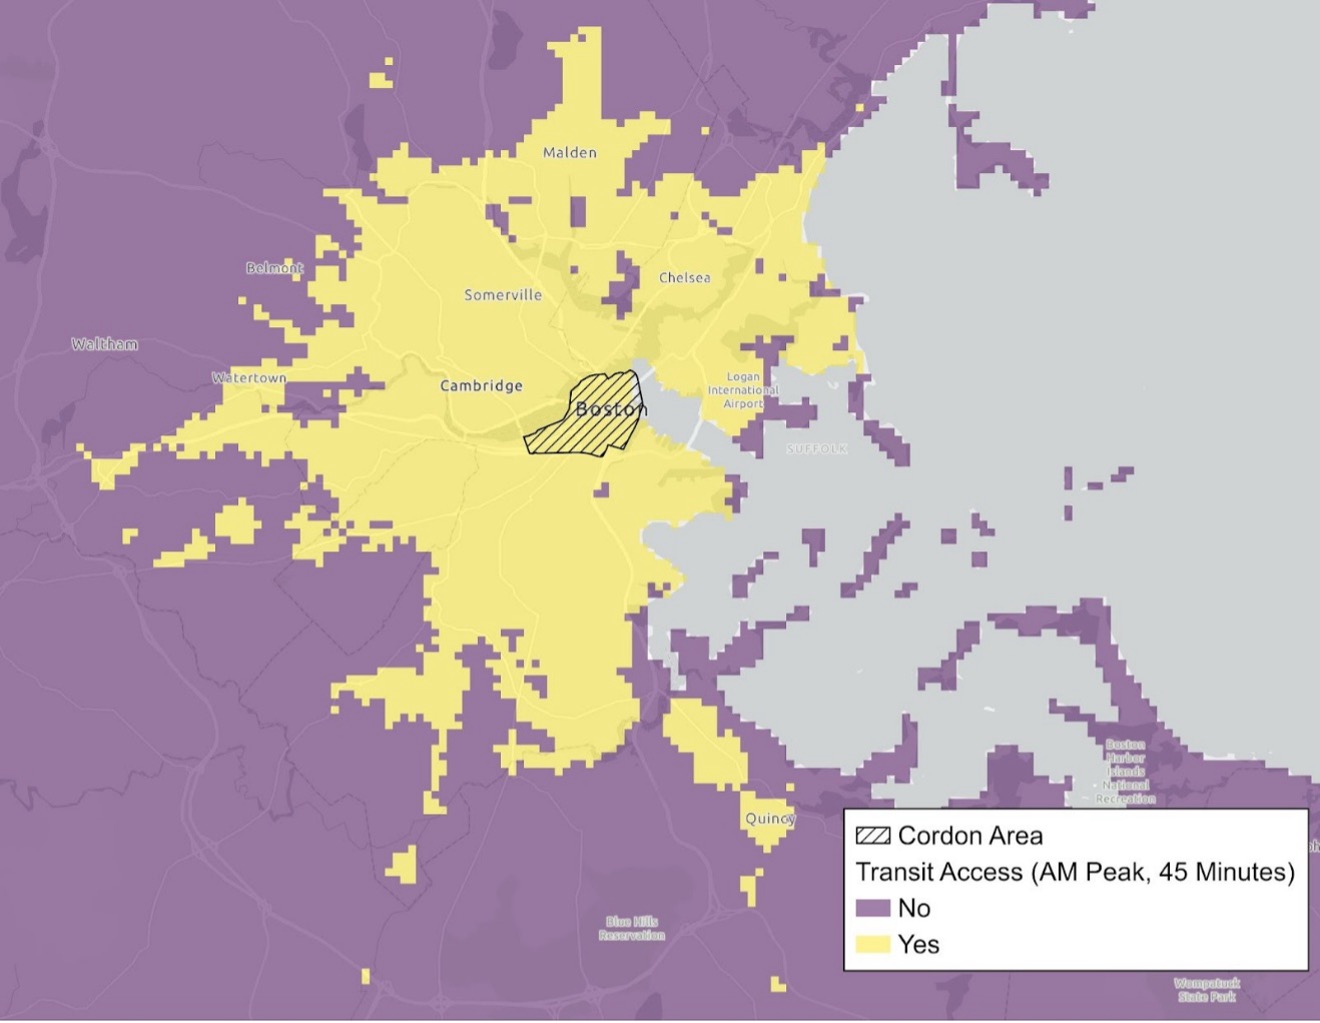
Source: Boston Region MPO staff and Conveyal data.
Areas with access to the hypothetical cordon zone are located entirely within the region’s Inner Core. Further from the cordon zone, access is concentrated along rail corridors where stations are easily accessible by walking. According to the Conveyal analysis, there are significant portions of the City of Boston that do not have access to the hypothetical downtown cordon area within a 30-minute transit trip, including parts of South Boston, Allston–Brighton, Dorchester, Mattapan, Roslindale, and West Roxbury, among others. Many of these gaps are also present in the 45-minute analysis.
The demographics of residents with access to the hypothetical cordon zone are summarized below in Table 4 for the 30- and 45-minute time bands. Regionwide totals for the Boston Region MPO are included for comparison.
Table 4
Sample Results: Demographics of Residents with Hypothetical Cordon Zone Access (AM Peak)
Demographic group |
Population Share Within 30-minute Transit Trip |
Population Share Within 45-minute Transit Trip |
Total MPO Region Population Share |
Minority |
47% |
35% |
37% |
Nonminority |
53% |
65% |
63% |
Low-income |
27% |
27% |
19% |
Non-low-income |
73% |
73% |
81% |
Source: Conveyal and United States Census data.
According to the Conveyal analysis, MPO region residents with transit access to the hypothetical cordon zone are more diverse and have lower incomes than the MPO region as a whole.
TDM23 is the regional travel demand model for the Boston region maintained by MPO staff. TDM23 is a trip-based travel demand model that estimates average weekday travel behavior across Massachusetts, Rhode Island, and southeastern New Hampshire. TDM23 takes a variety of inputs, including roadway networks, transit networks, and socioeconomic projections, to estimate trip patterns, mode share, vehicle volumes, and transit ridership across the model region for a given scenario.
TDM23 estimates of trip activity, roadway volumes, and transit mode share were used to define the hypothetical cordon zone scenario for this study. MPO staff then used TDM23 to identify the impacts to the regional transportation system as a result of the conceptual roadway-pricing scenario, including changes in trip mode share, vehicle volumes, transit ridership, and air quality. These results were compared to the Destination 2050 Recommended Plan scenario. The Recommended Plan scenario was chosen as the base scenario for this analysis because it includes several notable transit improvements over the model’s 2019 base year, including the Green Line Extension and the MBTA’s Bus Network Redesign.
This section details the process and results of using TDM23 to estimate the impacts of the conceptual roadway-pricing scenario on the transportation system. The results shown here correspond to the conceptual scenario selected for this study and are included to illustrate the tool’s ability to evaluate a variety of metrics measuring the impacts of roadway pricing.
Two different pricing scenarios were evaluated in TDM23, both of which were based on the 2050 Recommended Plan scenario from the MPO’s 2023 Long-Range Transportation Plan, Destination 2050. The first scenario evaluated a $9 charge (in 2025 dollars) to enter the zone, and the second evaluated a $15 charge. For each scenario, half of the charge was placed on all local roadway links that cross the cordon boundary, as well as highway ramps that feed into or out of the zone along I-90 and I-93. In this representation, a vehicle would pay half the charge upon entering the zone and half the charge upon exiting the zone, and the full amount is paid for a round trip. No transit improvements beyond those already present in the 2050 Recommended Plan scenario (including rapid transit frequency improvements and a full build of Bus Network Redesign) were included in these scenarios.
The roadway links that were subject to the cordon charge in these scenarios are illustrated below in Figure 4.
Figure 4
TDM23 Roadway Links with Hypothetical Cordon Charge
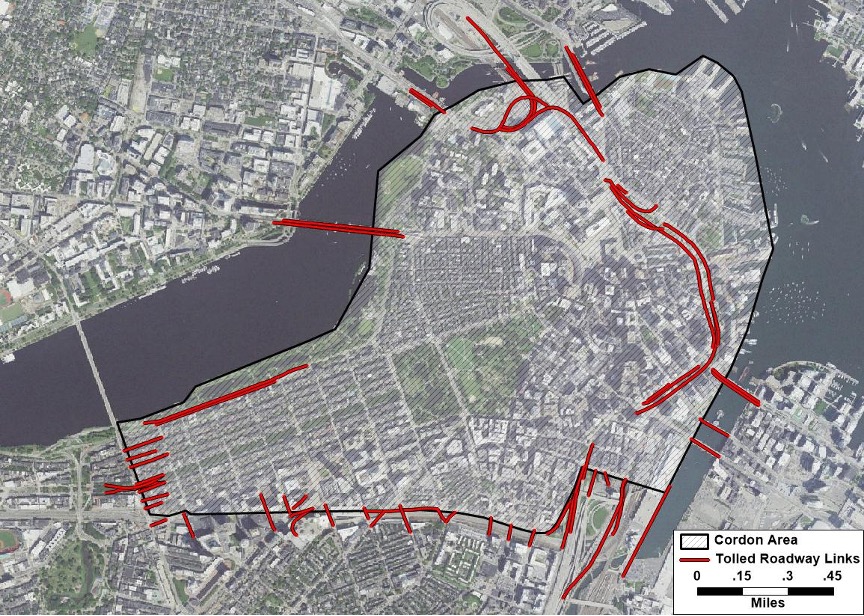
Source: Boston Region MPO staff and US Geological Survey satellite imagery.
TDM23 can estimate the change in the number of trips taken to and from the hypothetical cordon area on a typical weekday due to a cordon charge. For example, the change in daily person trips produced from the analysis of the hypothetical roadway pricing scenario are shown below in Table 5.
Table 5
Sample Results: Daily Person Trips to and from Hypothetical Cordon Zone
Trip Pattern |
LRTP Scenario |
Percent Change (LRTP to $9) |
Percent Change (LRTP to $15) |
Internal zone trips |
354,000 |
+2.5% |
+4.0% |
Trips to zone |
601,000 |
-1.8% |
-2.8% |
Trips from zone |
584,000 |
-2.1% |
-3.1% |
Non-zone trips |
36,196,000 |
+<0.01% |
+<0.01% |
Total trips |
37,735,000 |
+0% |
+<0.01% |
LRTP = Long-Range Transportation Plan.
Source: Boston Region MPO staff.
In the hypothetical roadway-pricing scenarios, model results estimate that about four percent of daily person trips in the model region occur to, from, or within the transportation analysis zones within the cordon area. TDM23 imposes consistency in the total number of trips and does not estimate trips foregone due to the increased cost of travel. Instead, it reassigns trips to alternative destinations, modes, or travel paths in response to changes in cost. Therefore, total daily trip activity across the model region (Massachusetts, Rhode Island, and southeastern New Hampshire) does not appreciably change between the three scenarios, with each scenario having approximately 37,735,000 daily person trips.
When a cordon charge is applied, more person trips are estimated to occur entirely within the cordon zone. This is likely due to a combination of factors. For one, reduced congestion within the cordon makes internal travel more desirable. In addition, auto travel that occurs entirely within the cordon is not subject to the congestion charge. Therefore, for trips beginning within the cordon boundary, a destination within the cordon area is preferable to crossing the cordon boundary.
Daily vehicle trips to and from the cordon area are summarized below in Table 6. These figures represent estimated auto trips only and do not include medium or heavy truck trips.
Table 6
Sample Results: Daily Vehicle Trips to and from Hypothetical Cordon Zone
Trip Pattern |
LRTP Scenario |
Percent Change (LRTP to $9) |
Percent Change (LRTP to $15) |
Internal zone trips |
42,500 |
-6.3% |
-8.2% |
Trips to zone |
199,200 |
-12.1% |
-18.5% |
Trips from zone |
195,300 |
-12.1% |
-18.6% |
Non-zone trips |
23,819,000 |
-0.3% |
-0.5% |
Total trips |
24,256,000 |
-0.5% |
-0.8% |
LRTP = Long-Range Transportation Plan.
Source: Boston Region MPO staff.
Overall auto activity decreases for all trip patterns when a charge is applied. When a $9 charge is applied for entering the hypothetical cordon zone, cumulative vehicle trips starting and/or ending within the zone decrease by 50,400 vehicle trips per day, or approximately 12 percent. In the $15 toll scenario, vehicle trips within the zone decrease by 76,600, an 18 percent reduction in vehicle trip activity starting and/or ending within the zone.
TDM23 can show the change in daily mode shares for trips from outside of the cordon area to the cordon area due to a cordon charge. Results from the hypothetical roadway-pricing scenarios are summarized in Table 7.
Table 7
Sample Results: Mode Share for Daily Trips to Hypothetical Cordon Area
Mode |
LRTP Scenario |
Change (LRTP to $9, Percentage Points) |
Change (LRTP to $15, Percentage Points) |
Drive alone |
15.9% |
-3.1% |
-4.5% |
2-person shared ride |
13.7% |
-0.3% |
-0.8% |
3-person shared ride |
12.8% |
+1.2% |
+1.8% |
Taxi/ride-hail |
2.6% |
-0.3% |
-0.5% |
Total auto |
45.0% |
-2.5% |
-4.0% |
Walk to transit |
26.0% |
+0.8% |
+1.5% |
Drive to transit |
12.0% |
+0.5% |
+0.9% |
Total transit |
38.0% |
+1.3% |
+2.4% |
Walk |
13.0% |
+0.9% |
+1.3% |
Bike |
4.0% |
+0.2% |
+0.4% |
Total non-motorized |
17.0% |
+1.1% |
+1.7% |
LRTP = Long-Range Transportation Plan.
Source: Boston Region MPO staff.
In the hypothetical roadway-pricing scenarios, the model estimates that when a cordon charge is introduced, there is a strong decrease in drive alone mode share, with trips instead choosing three-person shared ride, transit, and non-motorized modes. This corresponds to 30,000 fewer single-occupant vehicle trips to the cordon zone each day in the $9 scenario and 46,000 fewer daily single-occupant vehicle trips to the zone in the $15 scenario. With a $15 toll, the transit mode share (40.4 percent of all trips) exceeds the auto mode share (38.9 percent), and the majority of auto mode person-trips to the zone occur in higher-occupancy vehicles.
TDM23 can show the change in VMT and vehicle-hours traveled (VHT) for a roadway pricing scenario. Changes in VMT for the cordon area, City of Boston, Inner Core subregion, and Boston Region MPO for the hypothetical roadway-pricing scenarios are summarized below in Table 8. Changes in VHT are summarized in Table 9.
Table 8
Sample Results: Daily Vehicle-Miles Traveled by Scenario
Geography |
LRTP Scenario |
Percent Change (LRTP to $9) |
Percent Change (LRTP to $15) |
Cordon area |
1,116,000 |
-26% |
-31% |
City of Boston |
9,182,000 |
-6% |
-9% |
Inner Core subregion |
24,143,000 |
-4% |
-6% |
Boston Region MPO |
72,348,000 |
-2% |
-3% |
LRTP = Long-Range Transportation Plan. MPO = metropolitan planning organization.
Cordon area totals include non-tolled highways.
Source: Boston Region MPO staff.
Table 9
Sample Results: Daily Vehicle-Hours Traveled by Scenario
Geography |
LRTP Scenario |
Percent Change (LRTP to $9) |
Percent Change (LRTP to $15) |
Cordon area |
79,000 |
-37% |
-43% |
City of Boston |
576,000 |
-11% |
-15% |
Inner Core subregion |
1,339,000 |
-8% |
-10% |
Boston Region MPO |
2,895,000 |
-4% |
-6% |
LRTP = Long-Range Transportation Plan. MPO = metropolitan planning organization.
Cordon area totals include non-tolled highways.
Source: Boston Region MPO staff.
In the hypothetical roadway-pricing scenarios, the model estimates that VMT and VHT decrease significantly across all geographies when a toll is added. Within the cordon area, a $15 toll shows a 31 percent reduction in daily VMT and a 43 percent reduction in daily VHT. The higher percentage decrease in VHT (time) compared to VMT (distance) points to a decrease in vehicle-hours of congestion delay through the zone. In this example, the benefits of congestion reduction extend beyond the boundaries of the cordon zone, including in the City of Boston (349,000 fewer VHT and 84,000 fewer VMT), Inner Core subregion (1.54 million fewer VMT and 134,000 fewer VHT), and the entire Boston Region MPO (2 million fewer VMT and 180,000 fewer VHT). This suggests that the hypothetical roadway pricing scenario results in a regionwide decrease in vehicle travel rather than a redistribution of existing traffic throughout the region.
Differences in modeled roadway volumes between the LRTP scenario and $15 scenario are illustrated in Figure 5 for the AM time period and Figure 6 for the PM time period. Roadway links that show a decrease in traffic volumes in the $15 scenario are colored blue, and those that show an increase in volumes are colored red. The thickness of each line corresponds to the magnitude of the change on each link.
Figure 5
Sample Results: Difference in Roadway Volumes (AM Time Period) for
$15 Scenario
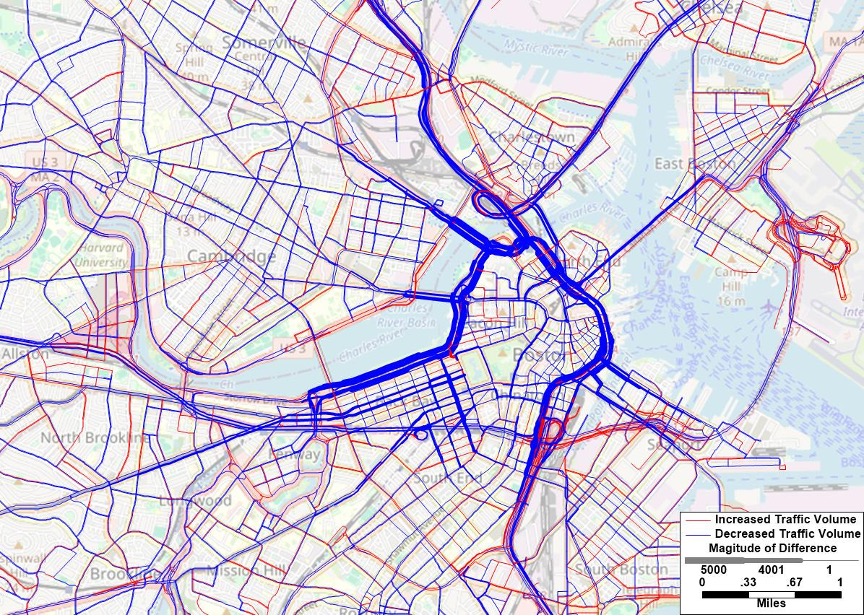
Source: Boston Region MPO staff and OpenStreetMap contributors.
Figure 6
Sample Results: Difference in Roadway Volumes (PM Time Period) for
$15 Scenario

Source: Boston Region MPO staff and OpenStreetMap contributors.
Roadways within the hypothetical cordon area see a large decrease in modeled roadway volumes, particularly Storrow Drive. The bridges that cross into the cordon area, including the Longfellow Bridge, North Washington Street Bridge, and Charles River Dam Road, all see similar decreases in roadway volumes. Conversely, the roadway segments with the highest increases in roadway volumes include the segments of I-93 near the interchange with I-90 (due to higher pass-through traffic volumes) and the ramps connecting the northern portion of I-93 to the Sumner and Callahan tunnels. There are modest traffic increases on circumferential roads such as Massachusetts Avenue, Memorial Drive, and Maffa Way, indicating that some traffic diverts onto routes that avoid the cordon area in this hypothetical scenario.
TDM23 can show changes in transit boarding for each mode due to a congestion charge. As an example, daily unlinked transit boardings by mode for the hypothetical roadway-pricing scenarios are summarized below in Table 10.
Table 10
Sample Results: Change in Daily Unlinked Transit Boardings by Mode
Mode |
LRTP Scenario |
Percent Change (LRTP to $9) |
Percent Change (LRTP to $15) |
Heavy rail |
637,100 |
+1.8% |
+4.3% |
Light rail |
232,700 |
+0.7% |
+2.6% |
MBTA local bus |
472,600 |
+1.6% |
+4.1% |
MBTA express bus |
8,100 |
+8.6% |
+12.3% |
Silver Line |
54,500 |
+4.2% |
+7.7% |
Commuter rail |
212,500 |
+0.7% |
+2.3% |
Commuter boat |
3,600 |
0% |
0% |
RTA bus |
67,200 |
+0.3% |
+0.3% |
Total |
1,688,300 |
+1.5% |
+3.7% |
LRTP = Long-Range Transportation Plan. MBTA = Massachusetts Bay Transportation Authority. RTA = regional transit authority.
Source: Boston Region MPO staff.
In the hypothetical roadway-pricing scenarios, the model estimates that transit ridership increases modestly in both priced scenarios. The largest percentage increases occur on the express bus, Silver Line, and local bus networks, while the greatest absolute increases in ridership occur on the heavy rail, local bus, and light rail systems.
TDM23 can also show change in rail rapid transit ridership by line due to a cordon charge. Results of the hypothetical roadway-pricing scenarios are summarized in Table 11.
Table 11
Sample Results: Change in Daily Rail Rapid Transit Boardings by Scenario
Line |
LRTP Scenario |
Percent Change (LRTP to $9) |
Percent Change (LRTP to $15) |
Red |
298,600 |
+1.7% |
+3.6% |
Orange |
236,000 |
+1.3% |
+3.9% |
Green |
224,500 |
+0.8% |
+2.7% |
Blue |
102,500 |
+3.6% |
+6.9% |
Mattapan |
8,100 |
0% |
+1.2% |
Total |
869,700 |
+1.5% |
+3.8% |
LRTP = Long-Range Transportation Plan.
Source: Boston Region MPO staff.
In the hypothetical roadway pricing scenario, the model estimates ridership increases of approximately three to four percent with the $15 charge on the Green, Orange, and Red lines. Ridership estimates on the Blue Line increase by nearly seven percent, while ridership estimate on the Mattapan Line increases by about one percent.
Additional exploratory modeling indicated that the model’s park-and-ride capacity constraint limits the shift towards transit. To test the impact of the park-and-ride capacity constraint, staff ran an additional scenario that modeled the effects of a $15 toll with twice the park-and-ride capacity at each station. This increased the total number of park-and-ride spaces in the model region from 76,708 to 153,416. Doubling the park-and-ride capacity increased commuter rail ridership by 5,700 daily riders compared to the $15 scenario. Heavy rail ridership increased by 1,100 daily boardings and light rail ridership increased by 2,100 daily boardings with increased park-and-ride capacity. Further sensitivity analysis of park-and-ride capacity in TDM23 could deepen our understanding of how this constraint impacts the modeled transit ridership, particularly for commuter rail.
TDM23 can estimate greenhouse gas and criteria pollutant emissions for each scenario. Emission rates are derived from the US Environmental Protection Agency’s Motor Vehicle Emissions Simulator model and are year-specific (therefore, 2050 emission rates were used for this analysis). Daily pollutant emissions within the Boston Region MPO are listed for each scenario in Table 12.
Table 12
Daily Pollutant Emissions by Scenario (Boston Region MPO)
Pollutant (kilograms) |
LRTP Scenario |
Percent Change (LRTP to $9) |
Percent Change (LRTP to $15) |
Carbon dioxide |
20,232,000 |
-2.2% |
-3.5% |
Carbon monoxide |
79,600 |
-2.1% |
-3.4% |
Nitrogen oxides |
2,320 |
-1.3% |
-2.6% |
PM2.5 |
77 |
-1.3% |
-2.6% |
Sulfur dioxide |
123 |
-1.6% |
-3.3% |
VOC |
1,860 |
-2.7% |
-3.8% |
LRTP = Long-Range Transportation Plan. MPO = metropolitan planning organization. PM2.5 = particulate matter less than 2.5 microns in diameter. VOC = volatile organic compounds.
Source: Boston Region MPO staff.
In the hypothetical roadway-pricing scenarios, model results estimate that emissions of all pollutants decrease in the priced scenarios across the MPO region. In the $15 scenario, regional carbon dioxide emissions from transportation decrease by 3.5 percent compared to the Destination 2050 Recommended Plan scenario. Municipal-level results from TDM23 show that all cities and towns in the MPO region exhibit a decrease or no significant change in vehicle emissions.
Revenue of the hypothetical roadway-pricing system can be estimated by multiplying the total daily volumes on the roadway links with cordon charges by the charge applied to these links. In the $9 scenario, the total inbound volume across these links is 175,000 vehicles per day, each paying a $9 charge. This results in an average weekday revenue of $1,575,000. When extrapolated over an entire year, accounting only for weekdays, this results in $410 million in annual revenue. In the $15 scenario, the total inbound volume across the roadway links with cordon charges is 150,000 vehicles per day, each paying a $15 charge. This results in a daily revenue of $2,250,000, or $585 million annually (weekdays only). Each scenario would also result in additional revenue from weekend travel, which TDM23 does not estimate.
Application of the available data and tools using a conceptual framework for roadway pricing allowed staff to evaluate the strengths and limitations of these resources.
Replica’s most significant strength is that, by using an activity-based framework, each trip is associated with an individual “person” in the synthetic population. Replica’s disaggregate structure provides metrics on the estimated demographics of people who may be affected by a roadway-pricing system, such as those who take auto trips through a potential congestion zone. In this way, Replica could provide helpful insights to support our understanding of travel behavior in the region.
Replica infers the demographics of people traveling based on Census and other data. Because demographics are not directly measured and may be subject to sampling bias, demographics patterns in trip making derived from Replica should be interpreted with appropriate consideration of data limitations. Active transportation trips are also not validated against real-world observations. In addition, Replica only provides a picture of past travel behavior and cannot be used to estimate the impacts of future changes to the transportation system. While Replica can inform researchers of travel patterns in a given area in the recent past and associate demographic information with each trip, it cannot estimate the behavior change associated with a new toll or congestion charge.
Conveyal has several key strengths and applications that would be useful for a roadway pricing analysis. Conveyal provides a sophisticated, multimodal routing engine that measures whether people can reach a destination in a given travel time. Beyond the analysis presented here, it is also possible to analyze how many destinations or types of destinations, such as healthcare centers or other essential places, are accessible across the region and to conduct these analyses at different spatial and temporal resolutions. These features would allow for a more detailed analysis of the equity implications of a roadway-pricing system.
With Conveyal, it is possible to evaluate how access to a congestion zone would change with different roadway, active transportation, and transit configurations. Conveyal allows users to test a variety of transit service scenarios, as represented in standard General Transit Feed Specification (GTFS) files. However, Conveyal cannot estimate the impact that changes in accessibility might have on travel behavior.
Among the data sources and tools evaluated for this study, TDM23 is the only tool that provides a forward-looking projection of travel behavior. TDM23 also provides the best estimates of the mode shift and air quality impacts of roadway pricing. As shown in Chapter 2 of this white paper, regional travel demand models are a key aspect of evaluating roadway-pricing systems, and TDM23 and its successors will be critical tools to advancing the MPO’s understanding of the potential effects of a roadway-pricing system.
TDM23 is also the most flexible tool evaluated in this research. The travel demand model is developed and maintained by the MPO, and staff have a deep understanding of the model components and how they perform. Future iterations of this work could vary model assumptions such as work from home behavior, parking constraint, transit fares and service levels, and land use to explore a range of potential outcomes of roadway pricing in the Boston region.
As a trip-based model, TDM23 does not provide disaggregated, person-level demographic information about travel behavior. Race and ethnicity are also not included in the synthetic population given as an input. As a result, one cannot directly estimate the demographics of those who travel to, from, or through an area with priced roadways.
In addition, transit service is not capacity constrained in TDM23 except for parking-capacity constraints at park-and-ride lots. Therefore, the ability of the transit network to service additional riders due to roadway pricing must be addressed through post-processing of model results or by comparison with other data sources or tools.
This section describes the data and tools that were used at various stages of this study, principally during the scenario selection process, but were not part of the analysis of the conceptual scenario presented in this report.
The National Performance Management Research Data Set (NPMRDS) is a vehicle probe-based travel time dataset acquired by the United States Federal Highway Administration to support state- and regional-level transportation performance measurement. NPMRDS provides data on vehicle speeds, average travel time, estimated delay, and other useful measures of congestion across the United States. For this study, staff used NPMRDS data for the scenario selection process to identify congested roadways that might benefit from a roadway-pricing system. Staff used vehicle speed data on major roadway segments (at five-minute intervals over several months’ worth of observations) to analyze where and when congestion is most likely to occur.
NPMRDS data provides nearly real-time data on highway speeds, with a high spatial and temporal resolution. Staff access this data through the RITIS Probe Data Analytics Suite, which provides many analytical tools to help interpret the data and evaluate the impacts of congestion across the region. However, NPMRDS is relatively limited in scope. NPMRDS is only evaluated over major highways and large, arterial roadways. This limits the data set’s utility over smaller areas and does not allow users to evaluate congestion on most local streets. The dataset only includes vehicle volumes and speeds, and provides no information on travel behavior, demographic information, or alternative modes of transportation. Therefore, this dataset can help identify key areas where congestion mitigation is most needed but not in evaluating roadway-pricing scenarios.
As a part of the MPO’s CMP, MPO staff created a new multimodal network in 2024 to visualize user volumes across the region’s busiest highway, transit, freight, bicycle, and pedestrian facilities. The network combines MBTA ridership data, average annual daily traffic data from the Massachusetts Department of Transportation’s Traffic Inventory, and auto, freight, bicycle, and pedestrian travel data from Replica. For this study, staff used the CMP multimodal network in the scenario selection process to identify areas where travel could most reasonably be shifted from high-traffic roadways onto existing transit, bicycle, and pedestrian infrastructure. This informed the selection of the chosen conceptual roadway-pricing scenario for this study by ensuring that the hypothetical cordon area contained both high travel demand and ample transit and active transportation coverage.
To fully evaluate a roadway-pricing system in the future, the MPO will require several new or updated data sources or tools.
For one, future travel demand model improvements might also allow MPO staff to forecast the effects of roadway-pricing policy levers that cannot be modeled in TDM23 or a trip-based model in general. These may include enhancements to the existing model structure; the development of complementary tools to investigate specific market segment responses; and/or the implementation of a disaggregated tour- or activity-based model structure, which would incorporate more person and household attributes into the modeled travel behavior.
The lack of regional parking data remains a significant barrier to evaluating roadway pricing, particularly parking pricing. Existing parking data in the region is usually at the municipal level and does not capture the full availability, usage, and pricing of on-street parking or private, off-street parking. This is significant for evaluating parking-pricing systems as well as assessing the broader impacts of parking on other types of roadway-pricing systems. As the MPO continues to pursue analyses of roadway pricing and parking policy, the development of a more complete regional parking dataset will be crucial to the success of these efforts.
On a smaller scale, GTFS files to represent potential future transit system improvements would enable modeling of enhancements that may be financed by roadway-pricing revenue. These GTFS files could be used in both Conveyal and TDM23 to model the combined impacts of roadway pricing and improved transit service on the regional transportation system.
The MPO has committed to advancing its research of roadway pricing through the FFY 2026 UPWP discrete study titled Roadway Pricing: Stakeholder Analysis. The FFY 2026 study will build on the work presented in this white paper through a stakeholder analysis. The study will also assess the strategies used by other agencies when successfully implementing roadway pricing to lay the groundwork for an effective engagement strategy for the Boston region.
In addition to the analysis presented here, the work completed for this study revealed several areas of focus for future research into the potential impacts of roadway pricing in the Boston region. Different roadway-pricing systems, policies, or tolls could be iteratively evaluated using the tools discussed here to assess their relative effects on congestion, revenue, and equity. This may include different cordon fee amounts, new cordon area scenarios, or different roadway-pricing methods (such as other roadway usage schemes, corridor pricing, or parking pricing). An iterative evaluation of different cordon areas, prices, and other policies would illuminate the potential range of regional impacts of roadway pricing and improve our understanding of which factors have the greatest impacts in advancing regional transportation goals.
Furthermore, roadway-pricing revenue is sometimes allocated to improvements in transit service. A future study could compare the effects of various transit improvement scenarios, such as service expansion, frequency improvements, or additional transit system capacity, that could be financed with roadway-pricing revenue. Further analysis of transit system performance may also help quantify improvements to transit access, travel time, and reliability due to reduced congestion in the region. Moreover, analyses could be done to identify targeted transit system investments to mitigate potential negative equity impacts of roadway pricing.
These analyses could be part of a more detailed exploration of roadway pricing using TDM23. Further exploration of features such as park-and-ride capacity, the potential to vary tolls by time of day, and alternative representations of congestion pricing within the model structure could be considered. Other model components could be leveraged to explore the potential range of roadway pricing outcomes.
There are also further opportunities to use Conveyal to evaluate transit access to a cordon pricing area. A different type of Conveyal analysis, such as an analysis of origin-destination travel times, could be used to develop a more refined estimate of access to the congestion zone, rather than simply assessing whether any part of the cordon area could be accessed. In future analyses, Conveyal could be used to estimate improvements to destination access if transit system enhancements were implemented alongside a roadway-pricing program. Custom GTFS files could be generated to model potential service improvements, expansion, or other transit upgrades to help quantify these other potential benefits of a roadway-pricing system.
Future research could explore the feedback between various data sources and tools. More detailed Conveyal outputs could be used to inform further analyses of modeled travel patterns using TDM23 or Replica. As part of this exercise, Replica demographic and travel behavior data for the Boston region could be compared to other sources, such as the Census Transportation Planning Products, to further assess their validity in representing travel in the region. The 2025 Massachusetts Travel Survey will also provide a greater understanding of current travel behavior, supplying further analyses with a more robust data set to understand the potential impacts of roadway pricing on people and transportation in the region.
In summary, the following items are strong candidates for the MPO to explore in its future research:
This study aimed to evaluate data and tools available to the MPO to support analyses of roadway pricing in the Boston region. Table 13 summarizes the data sources and analytical tools used for this study, including their applications, key strengths, and sample metrics each tool can provide.
Table 13
Summary of Data and Tools
Tool |
Applications |
Strengths |
Example Metrics |
Replica |
Estimating travel behavior under different transportation scenarios |
Disaggregate demographic data provides useful insights |
Trip mode shares, trip taker demographics, and origin/destination patterns |
Conveyal |
Analysis of destination access under different transportation scenarios |
Allows for demographic analyses of different transit service scenarios |
Destination access, associated demographics, and revenue reinvestment impact |
TDM23 |
Estimating roadway, transit, air quality, and environmental justice impacts of different scenarios |
Provides forecasts of future transportation impacts, rather than just analyzing current or past behavior |
Trip mode shares, trip volumes by purpose and mode, regional VMT/VHT, origin/destination patterns, air quality impact, potential revenue, and revenue reinvestment impact |
NPMRDS |
Identifying roadways that could benefit from pricing |
Data is available in nearly real time and many tools are provided to interpret results |
Person and vehicle hours of delay, monetary cost of travel delay, and historical average speeds |
CMP Multimodal Network |
Visualizing heavily used roadways and transit corridors |
Visualizes multiple modes of travel in a simple data view |
Roadway volumes and transit ridership |
CMP = Congestion Management Process. NPMRDS = National Performance Management Research Data Set. VHT = vehicle-hours traveled. VMT = vehicle-miles traveled.
Source: Boston Region MPO staff.
The tools assessed for this study each provide unique insights into the potential impacts of roadway pricing. Replica’s disaggregate model structure provides metrics on the estimated demographics and existing travel behavior of people who may be impacted by a roadway-pricing system. Conveyal can be used to evaluate transit accessibility under different scenarios in the MPO region. TDM23 offers a uniquely forward-looking perspective among the tools examined here and is the only one of these tools that estimates future-year projections of travel behavior. TDM23 also provides estimates of the mode shift and air quality impacts of roadway pricing.
This study also identified several development needs for further data and tools that would be useful in evaluating roadway-pricing impacts. As the MPO develops future iterations of the regional travel demand model, enhancements to the existing travel demand model structure could support more nuanced evaluation of different roadway-pricing scenarios. In addition, development of complementary tools to investigate specific market segment responses to roadway pricing, and/or the implementation of a disaggregated tour- or activity-based model structure could help parse the impacts of roadway pricing on different demographic groups. GTFS files could be generated to represent potential future transit system improvements, which would enable the modeling of transit service enhancements that might be financed or otherwise enabled by roadway pricing. The lack of regional parking data remains a barrier to evaluating the impact of parking pricing policy in the region.
The analysis conducted for this study illustrates the MPO’s capacity to estimate a variety of metrics measuring the congestion, revenue, and equity impacts of roadway pricing using a strategic mix of tools and data. Using Replica, demographic patterns of current travelers through this study’s conceptual roadway pricing zone were estimated, including how these demographics differ by mode. In Conveyal, the analysis identified which areas of the region are able to access this study’s cordon area by transit and compared the demographics of residents with access versus those without access. TDM23 was leveraged to forecast the transportation system impacts of this study’s conceptual cordon pricing scenario, including changes to trip-taking behavior, mode choice, vehicle travel, and transit usage. These insights made it possible to measure the estimated impacts to regional air quality and arrive at a high-level approximation of system revenue. Together, these metrics can lay the groundwork for a robust equity analysis of roadway pricing, allowing the MPO and other stakeholders to understand who will be impacted by roadway pricing initiatives and who is well-served by viable transit alternatives.
Overall, the MPO has a robust suite of tools at its disposal to analyze the impacts of roadway pricing, and each of the tools presented in this report would be a useful component of future analyses. As the MPO continues to study roadway pricing and its potential impacts on the region, a diverse set of data sources and analytical tools will provide the most robust understanding of these effects. Given each tool’s strengths in evaluating transportation, combining the results of a broad suite of tools will allow the MPO to help stakeholders understand and respond to regional questions, concerns, and priorities surrounding roadway pricing. Further research into these tools and their capabilities will allow the MPO to address a diverse set of regional priorities in its future work on roadway pricing, supporting the region in exploring ways to maximize the benefits of roadway pricing while understanding and mitigating any potential negative impacts.
CIVIL RIGHTS NOTICE TO THE PUBLIC
Welcome. Bem Vinda. Bienvenido. Akeyi. 欢迎. 歡迎
You are invited to participate in our transportation planning process, free from discrimination. The Boston Region Metropolitan Planning Organization (MPO) is committed to nondiscrimination in all activities and complies with Title VI of the Civil Rights Act of 1964, which prohibits discrimination on the basis of race, color, or national origin (including limited English proficiency). Related federal and state nondiscrimination laws prohibit discrimination on the basis of age, sex, disability, and additional protected characteristics.
For additional information or to file a civil rights complaint, visit www.bostonmpo.org/mpo_non_discrimination.
To request this information in a different language or format, please contact:
Boston Region MPO Title VI Specialist
10 Park Plaza, Suite 2150
Boston, MA 02116
Phone: 857.702.3700
Email: civilrights@ctps.org
For people with hearing or speaking difficulties, connect through the state MassRelay service, www.mass.gov/massrelay. Please allow at least five business days for your request to be fulfilled.