Trucks in the South Boston Waterfront
Project Manager
Bill Kuttner
Project Principal
Mark Abbott
Graphics
Kate Parker-O’Toole
Cover Design
Kim DeLauri
The preparation of this document was supported
by the Federal Highway Administration through
MHD 3C PL contracts #32075 and #33101.
Central Transportation Planning Staff
Directed by the Boston Region Metropolitan
Planning Organization. The MPO is composed of
state and regional agencies and authorities, and
local governments.
To request copies of this document or
copies in an accessible format, contact:
Central Transportation Planning Staff
State Transportation Building
Ten Park Plaza, Suite 2150
Boston, Massachusetts 02116
(857) 702-3700
(617) 570-9192 (fax)
(617) 570-9193 (TTY)
ctps@ctps.org
www.bostonmpo.org
The South Boston Waterfront is arguably the most intensely studied area of Boston. Both the Seaport Public Realm Plan, prepared by the Boston Redevelopment Authority in 1999, and the South Boston Transportation Study, prepared by the City of Boston in 2000, envisioned strong growth in housing and non-industrial employment, and continued vitality in water-related and other industrial activities. After more than a decade of development, the South Boston Waterfront Sustainable Transportation Plan, in 2015, afforded an update to the earlier transportation plan.
As trucking is the predominant freight mode serving the South Boston Waterfront, this report complements the two studies cited above by developing a detailed picture of truck operations in the South Boston Waterfront—analyzing the traffic volumes, travel patterns, and needs of the neighborhood. First, we defined eight distinct types, or classes, of trucks and a cordon of ten locations through which almost all truck movements into and out of the South Boston Waterfront cross. We observed trucks in each of the eight classes entering and exiting the cordon area during five specified time periods throughout the day. The results of this fieldwork represent the major findings of this report.
Staff organized the truck travel data and used it to analyze current traffic and roadway issues in the study area from the perspective of the trucks that serve it. Issues analyzed from this perspective include the
This study does not make specific recommendations, rather, it contributes additional freight and truck data and analyses, which study-area stakeholders and operating agencies may utilize when developing policies and programs within their areas of responsibility.
1.1 Background
1.2 Goals of the Study
2. Estimating Truck Volumes by Truck Type
2.1 Defining a Cordon Area
2.2 Descriptions of Cordon Points
2.3 The Definition of “Truck”
2.4 Total Daily Cordon Volumes
2.5 Types of Trucks
2.6 Cordon Volumes by Truck Type
3. Applying Truck Data to Waterfront Planning Issues
3.1 Congestion in the South Boston Waterfront
3.2 Growth in Ocean Shipping
3.3 Other Planning Issues
TABLE 1 All Trucks
TABLE 2 Truck Classification Groups
TABLE 3 Two-way Truck Volumes by Cordon Point and Truck Type
TABLE 4 Single-Unit Box-Type Trucks (Unrefrigerated)
TABLE 5 Box-Type Semi-Trailers (Unrefrigerated)
TABLE 6 Single-Unit Refrigerated Trucks
TABLE 7 Refrigerated Semi-Trailers
TABLE 8 Single-Unit Trucks: Other Configurations
TABLE 9 Semi-Trailers: Other Configurations
TABLE 10 Hazardous Cargoes
TABLE 11 Ocean Shipping Containers
FIGURE 1 South Boston Waterfront Cordon Area
FIGURE 2 Typical Truck with Doubled Rear Wheels
FIGURE 3 Single-Unit Box-Type Trucks (Unrefrigerated)
FIGURE 4 Box-Type Semi-Trailer (Unrefrigerated)
FIGURE 5 Single-Unit Refrigerated Trucks
FIGURE 6 Refrigerated Semi-Trailer
FIGURE 7 Single-Unit Trucks with Other Configurations
FIGURE 8 Semi-Trailer with Other Configuration
FIGURE 9 Truck Displaying Hazardous Cargo Placards
FIGURE 10 Ocean Shipping Container
FIGURE 11 Trucks Going to Conley Terminal via East First Street
FIGURE 12 Locations Served by Conley Terminal Ocean Containers
The South Boston Waterfront is arguably the most intensely studied part of the city of Boston, and to a large degree, these studies have focused on transportation. Like many urban districts, the South Boston Waterfront (the study area) owes its character largely to its location on the waterfront and proximity to Boston’s central business district. Culminating early in the last century, this waterfront area was transformed from extensive tidal flats into a working port with adjacent industrial property via an intensive landfill project. At that time, the South Boston Waterfront was connected with the rest of North America primarily by the freight rail network, along with a limited street system.
By the 1970s, the containerization of ocean shipping and completion of the Interstate Highway System had fundamentally changed the nature of port operations and the geographical distribution of industrial activity. The South Boston Waterfront, wedged between Boston’s central business district and a residential neighborhood, already had declined into mostly underutilized land and would now be transformed into something entirely new. Once again, the character of the South Boston Waterfront would be shaped largely by its transportation infrastructure.
The need to expand the capacity of the Central Artery in downtown Boston had long been acknowledged. When plans for its reconstruction began in earnest in the 1980s, the decision was made to incorporate a third harbor tunnel into the project, the entire effort coming to be known as the CA/T project. A set of ramps connecting Interstates I-90 and I-93 with the changing waterfront area became key features of the project and literally formed the road map within which subsequent planning would take place.
The Boston Redevelopment Authority (now the Boston Planning and Development Agency) published The Seaport Public Realm Plan in 1999.1 This report presented a vision for land use and development in the South Boston Waterfront and clearly delineated areas that were preserved for industrial use by policy or regulation. The non-industrial parcels slated for development were closer to downtown Boston, and even with important designations of future open space, the anticipated development clearly would be massive.
A companion study, South Boston Transportation Study was completed by the City of Boston in 2000.2 This report contained a detailed analysis of how a newly redeveloped South Boston Waterfront could best utilize the expanding transportation system that was under construction at that time. Again, the activities of the working port were acknowledged and the volumes of truck traffic that would support port and related industrial activities were anticipated and planned for.
Development of the South Boston Waterfront accelerated after completion of the CA/T project and the new Silver Line Waterfront bus rapid transit facility in 2004. A decade later, with development still less than half built out, a need for a fresh look at the area’s transportation challenges became apparent. The planning and engineering firm VHB was retained by a group of governmental and non-governmental stakeholders to lead a study that would update and expand upon the work of the South Boston Transportation Study.3
While the importance of trucks in the South Boston Waterfront were consistently acknowledged and accurately described in these earlier studies, the truck data in these studies were at a descriptive rather than analytical level of detail; such that in most cases, area stakeholders who wished to perform calculations on the number of trucks or consider the utilization of trucks by type and purpose needed to collect data anew.
The cornerstone of this study is to develop a strong baseline of truck traffic data for the South Boston Waterfront. Staff has collected truck data exclusively through field observation, which allows for all trucks to be characterized by type or function. These vetted data are presented here.
There are many transportation and development issues currently being studied by South Boston Waterfront stakeholders. This report uses some of the new truck data to analyze several of these current planning issues from a freight perspective.
These data can also serve as a baseline for further, more detailed data; throughout this report, we will suggest investigations that could build upon this data. We also will discuss the possibility of incorporating these data into the calibration process for the Boston Region Metropolitan Planning Organization (MPO) travel demand model.
The analytical framework used in this study is the traffic cordon. We have identified a portion of the South Boston Waterfront road network where vehicles could enter or leave at number of well-defined points. We assume that, during the course of a typical weekday, the number of vehicles of each type that enter and leave the cordon area is the same, which is the key to organizing data gathered in the field into useful traffic information.
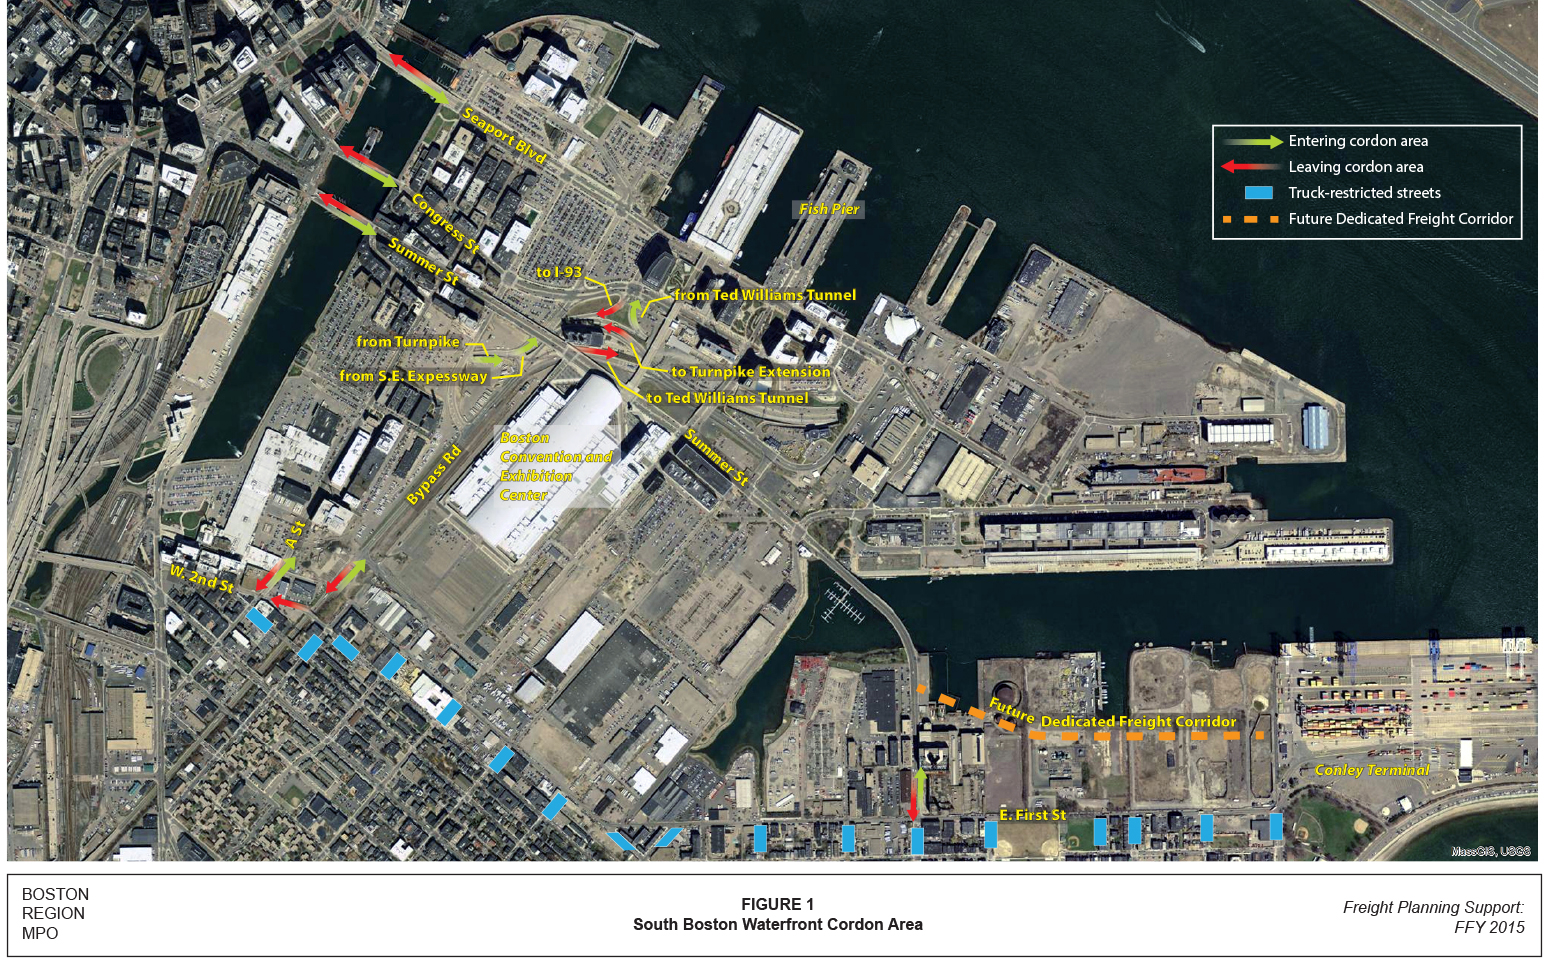
The South Boston Waterfront and the study cordon points are shown in Figure 1, and indicated by the following:
Locations where trucks can enter the cordon area are indicated with green arrows. In most cases, these arrows represent the inbound direction of a two-way street. Highway exit ramps are also shown in this manner.
Locations where trucks can leave the cordon area are indicated with red arrows. In most cases, these arrows represent the outbound direction of a two-way street. Highway entrance ramps and a one-way street leaving the cordon area are also shown in this manner.
Trucks with more than 2.5 tons of capacity are prohibited on residential streets that meet the South Boston Waterfront. Trucks serving local destinations are exempt from this prohibition; Summer Street at East First Street shows both a blue truck prohibition shading and cordon count arrows for trucks serving local businesses.
The other studies cited in Section 1 had defined formal study areas that included and extended beyond the cordon area used in this study. The cordon area here has been defined in a way that facilitates the acquisition and analysis of truck flow data. The findings developed for this study’s cordon points can inform planning issues both within and outside the cordon area; some of these issues will be discussed later in this report.
For the purposes of this study the cordon crossing points have been divided into three groups: three arterial streets crossing the Fort Point Channel, ramps onto and off of the express highway system plus the South Boston Bypass Road, and city streets that connect with the South Boston neighborhood. The routes and districts served by these cordon-crossing points relate closely to how truck traffic enters and leaves the South Boston Waterfront.
Seaport Boulevard, and Congress and Summer Streets allow trucks to reach destinations in downtown Boston as well as use I-93 ramps, mostly to and from the north; and for a number of movements, the three crossings can substitute for each other.
These cordon points are actually within the cordon area rather than at its periphery. Three distinct freeway entrance ramps lead to I-90 eastbound into the Ted Williams Tunnel, I-90 westbound to the Turnpike Extension, and to I-93, both northbound and southbound. For the reciprocal movements, three distinct freeway exit ramps bring traffic into the Waterfront area from the Ted Williams Tunnel, the Turnpike Extension, and I-93. The exit ramp from I-93 is only bringing traffic from the south. Traffic coming to the Waterfront from the north on I-93 must use one of the Fort Point Channel arterials.
The South Boston Bypass Road was built as part of the CA/T project. It supported construction of the CA/T and has continued as a truck-only route connecting the Waterfront with I-93 and nearby industrial areas. The cordon point is just south of an intersection with Cypher Street, at the north end of a grade-separated right-of-way that the Bypass Road shares with a freight rail spur.
Most city streets between the South Boston Waterfront and the historic South Boston residential neighborhood do not allow through truck traffic. At the western end of the cordon area is A Street, a two-way street that does permit truck traffic. A Street is intersected by Second Street, a one-way street that allows all traffic, including trucks, to leave the cordon area.
While package delivery and garbage trucks are generally permitted to use South Boston residential streets, only Summer Street at the eastern end of the cordon area has been counted as part of the cordon for this analysis because of the substantial number of businesses that can be serviced by trucks entering and leaving at that point.
Trucks are defined in this study as any vehicle with six or more wheels not including buses. The six-wheel criterion is useful in several practical respects. First, it determines which trucks are subject to local truck restrictions, which as a general rule define trucks as having a 2.5-ton carrying capacity. The Boston Region MPO’s regional travel demand model identifies streets with local truck restrictions and truck-restricted parkways, and can designate a reduced “truck-only” model network for which trip volumes by these six-wheeled trucks can be estimated.
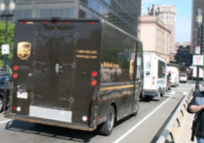
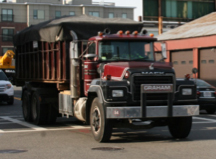
Another practical benefit of the six-wheel definition is the ease of truck identification. For the traffic tabulator in the field, the presence of six wheels is clear and unambiguous, as illustrated in Figure 2. If a non-passenger vehicle has six wheels, it is a truck. If it has four wheels, it is not, regardless of markings or vehicle body type.
FIGURE 2
Typical Truck with Doubled Rear Wheels
Leaving cordon area on Summer Street near First Street
Source: Author
Large numbers of four-wheeled vehicles are engaged in commerce rather than household travel, and many of these vehicles transport goods. These are all light vehicles, however, and the entire road network is available for their use. Light commercial vehicles are represented in the MPO regional travel demand model, but they are not a topic of this study.
Table 1 shows the total numbers of trucks of all types observed entering or leaving the cordon area. It cites the ten cordon-crossing points and the number of trucks using each crossing point by direction. The table also presents estimates of truck volumes by direction for five typical hours over the course of a weekday.
Some of the cordon point characteristics described above are reflected in these combined truck volumes. Bypass Road was designed specifically as a preferred choice for trucks to enter or leave the South Boston Waterfront. In fact, the estimated 1,519 trucks that use Bypass Road represent almost one-fourth of 6,230 trucks entering the cordon area on a typical day.
The numbers of trucks entering and leaving the cordon area at any particular point can vary significantly, reflecting practicalities of traffic patterns at that particular point. An extreme example is the number of trucks using the entrance and exit ramps to and from I‑93. As noted above, the 530 trucks leaving by this ramp can travel either north or south on I-93, whereas the 139 trucks entering the cordon area have come from only the south.
A less extreme imbalance is seen in the Williams Tunnel. The 406 trucks leaving the cordon area do not need to pay a toll, whereas the 355 trucks entering the cordon area do need to pay a toll at one of the Logan Airport toll plazas. Trucks serving locations in North Shore communities can arrange their trips to avoid tolls if they use the Williams Tunnel in the outbound direction and Route 99, Route 16, or some other roadway inbound.
The heavily used Bypass Road has significantly more traffic entering than leaving the cordon area. This counterbalances much of the net outflow of trucks observed at the I-93 ramps, Williams Tunnel ramps, and the one-way Second Street cordon point.
The total volumes of trucks entering and leaving the cordon area show very similar patterns over the course of the day. Truck traffic peaks and remains strong during mid-morning and midday, then tapers off during the afternoon. Truck traffic is lowest during the PM peak period (“peak” in these instances refers to all traffic).
TABLE 1
All Trucks
| Cordon Point | Daily Trucks by Cordon Point: Two-way | Daily Trucks by Cordon Point: Entering | Daily Trucks by Cordon Point: Leaving | Trucks Entering Cordon During a Typical Hour: AM Peak | Trucks Entering Cordon During a Typical Hour: Mid-morning | Trucks Entering Cordon During a Typical Hour: Midday | Trucks Entering Cordon During a Typical Hour: Afternoon | Trucks Entering Cordon During a Typical Hour: PM Peak | Trucks Leaving Cordon During a Typical Hour: AM Peak | Trucks Leaving Cordon During a Typical Hour: Mid-morning | Trucks Leaving Cordon During a Typical Hour: Midday | Trucks Leaving Cordon During a Typical Hour: Afternoon | Trucks Leaving Cordon During a Typical Hour: PM Peak | ||
| Fort Point Channel Seaport Boulevard | 778 | 367 | 410 | 33 | 38 | 40 | 33 | 9 | 41 | 44 | 45 | 28 | 13 | ||
| Fort Point Channel Congress Street | 343 | 185 | 158 | 19 | 15 | 12 | 15 | 16 | 23 | 19 | 10 | 8 | 6 | ||
| Fort Point Channel Summer Street | 670 | 456 | 214 | 34 | 51 | 44 | 33 | 28 | 24 | 27 | 17 | 15 | 6 | ||
| Expressway System Turnpike Extension | 658 | 374 | 283 | 20 | 38 | 36 | 41 | 21 | 23 | 25 | 26 | 28 | 16 | ||
| Expressway System Williams Tunnel | 761 | 355 | 406 | 32 | 32 | 29 | 32 | 23 | 27 | 36 | 40 | 38 | 28 | ||
| Expressway System I-93 | 670 | 139 | 530 | 9 | 21 | 16 | 7 | 5 | 18 | 49 | 72 | 59 | 23 | ||
| Expressway System Bypass Road | 1,519 | 924 | 595 | 70 | 88 | 103 | 73 | 51 | 48 | 63 | 75 | 39 | 23 | ||
| South Boston A Street | 523 | 223 | 300 | 21 | 29 | 18 | 17 | 8 | 21 | 40 | 28 | 22 | 14 | ||
| South Boston Second Street | 125 | 0 | 125 | 0 | 0 | 0 | 0 | 0 | 11 | 11 | 10 | 12 | 8 | ||
| South Boston Summer St. at E. First | 185 | 91 | 94 | 7 | 9 | 17 | 3 | 2 | 7 | 14 | 14 | 3 | 1 | ||
| Total Trucks by Time Period | 6,230 | 3,115 | 3,115 | 245 | 321 | 315 | 254 | 163 | 243 | 328 | 337 | 252 | 138 | ||
| Note: Second Street is one-way at the cordon. Columns may not sum exactly to column total because of rounding. | |||||||||||||||
| Source: CTPS | |||||||||||||||
The 6,230 trucks entering or leaving the cordon area each day represent a very wide variety of types of vehicles and businesses served. As mentioned earlier, the only thing these vehicles have in common is that they have at least six wheels and normally cannot travel on truck-excluded parkways or city streets.
For the purposes of this study, tabulators taking manual counts at cordon points were asked to classify each truck entering or leaving the cordon into one of eight groups. Table 2 cites these eight groups and the total numbers of each truck type observed. These classifications were defined both to facilitate identification in the field and to be able to relate truck types with their logistic functions to some degree. The order of the groups in Table 2 reflects the features that tabulators must note.
Table 2 also lists some selected examples of trucks for each classification group that have been observed recently in the South Boston Waterfront. They only hint at the degree of diversity found among heavy vehicles. However, it is still possible to make limited generalizations about the activities and travel patterns of the eight groups, and we offer these observations later in the sections that focus on each classification group.
Dividing the total two-way truck volumes at the ten cordon points of Table 1 by the eight types of trucks described in Table 2 gives the truck traffic burden at each cordon point by truck type (see Table 3).
The ten cordon points are ranked by total two-way truck volumes with the heavily utilized Bypass Road appearing at the top of the table. Total trucks by type appear at the bottom of the table. The columns are arranged by type of truck, with the most often observed type, the single-unit unrefrigerated box-type truck appearing in the left column. The columns that follow are in descending order of total cordon volume for each truck type; the 24 trucks with hazardous cargoes are listed last, next to the daily total column.
Table 3 reveals several relationships that are not readily apparent in Tables 1 and 2. While Bypass Road is by far the most heavily used route for trucks entering or leaving the cordon area, the next five cordon points are tightly clustered between 778 trucks per day on Seaport Boulevard and 658 trucks coming from or going to the Turnpike Extension. The numbers of trucks using Summer Street, the Williams Tunnel ramps, or the I-93 ramps fall between these two values.
TABLE 2
Truck Classification Groups
| Truck Groups and Weekday Volumes | Selected Examples | |||||||
| Box-type trucks (unrefrigerated): single-unit | Certain Fedex and UPS trucks | |||||||
| 1,680 | Office supply delivery trucks | |||||||
| Certain Beverage delivery trucks | ||||||||
| Bakery delivery trucks | ||||||||
| Linen and uniform services | ||||||||
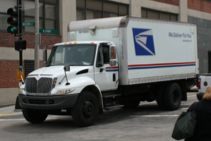
| Box-type trucks (unrefrigerated): semi-trailers | U.S. Postal Service trucks | |||||||
| 412 | Air freight consolidator trucks | |||||||
| Refrigerated trucks: single-unit | Seafood distributors | |||||||
| 1,186 | Produce distributors | |||||||
| Refrigerated trucks: semi-trailers | Seafood packers | |||||||
| 356 | Supermarket chain distribution | |||||||
| Other configurations: single-unit | Garbage trucks | |||||||
| 1,604 | Dump trucks | |||||||
| Construction supplies | ||||||||
| Certain public utility repair vehicles | ||||||||
| Other Configurations: semi-trailers | Dump trucks | |||||||
| 316 | Construction supplies | |||||||
| Ocean shipping container chassis | ||||||||
| Ocean shipping containers | 40-foot containers | |||||||
| 652 | 20-foot containers | |||||||
| Hazardous cargoes | Tank trucks with hazard placards | |||||||
| 24 | Welding supplies with placards | |||||||
| 6,230 | Total Trucks | |||||||
| Note: Weekday volumes are two-way volumes at all the South Boston Waterfront | ||||||||
| cordon locations combined. | ||||||||
| Source: CTPS | ||||||||
TABLE 3
Two-way Truck Volumes by Cordon Point and Truck Type
| Cordon Points | Single-unit: Box-type Trucks | Single-unit: Other Configurations | Single-unit: Refrigerated | Ocean Shipping Containers | Box-type Semi-Trailers | Refrigerated Semi-trailers | Semi-trailers: Other Configurations | Hazardous Cargoes | Total Trucks |
| Bypass Road | 242 | 341 | 403 | 187 | 98 | 156 | 79 | 12 | 1,519 |
| Seaport Boulevard | 235 | 192 | 139 | 98 | 31 | 29 | 48 | 5 | 778 |
| Williams Tunnel | 178 | 178 | 204 | 48 | 89 | 46 | 19 | 761 | |
| Summer Street | 264 | 240 | 79 | 19 | 24 | 24 | 19 | 670 | |
| I-93 | 127 | 101 | 89 | 204 | 48 | 41 | 60 | 670 | |
| Turnpike Extension | 190 | 130 | 79 | 79 | 55 | 55 | 70 | 658 | |
| A Street | 197 | 178 | 82 | 12 | 46 | 7 | 2 | 523 | |
| Congress Street | 154 | 91 | 79 | 5 | 10 | 2 | 2 | 343 | |
| Summer St. at E. First | 53 | 94 | 19 | 5 | 5 | 10 | 185 | ||
| Second Street | 41 | 60 | 12 | 7 | 2 | 2 | 125 | ||
| All Locations | 1,680 | 1,604 | 1,186 | 652 | 412 | 356 | 316 | 24 | 6,230 |
| Source: CTPS |
While Bypass Road far exceeds the other cordon points in terms overall truck traffic, it is the most used cordon point for only six of the eight truck types. The 242 single-unit box-type trucks using Bypass Road are exceeded by the 264 trucks of the same type that use the Summer Street cordon point at Fort Point Channel. This cordon point is adjacent to the South Station Postal Annex, which is served by a large number of trucks of this type. Summer Street is also an important route between parcel delivery services based in the South Boston Waterfront and a dense concentration of package delivery customers in Boston’s financial district.
Ocean containers are the other group for which Bypass Road is only the second-most-used cordon point. The ramps to and from I-93 are used by more ocean containers than use Bypass Road, reflecting the fact that ocean containers largely serve locations throughout eastern Massachusetts. While I-93 can be accessed via Bypass Road, the local industrial destinations Bypass Road serves are comparatively less important to the ocean container travel market. Interestingly, more ocean containers use the I-93 ramps than any other truck type.
Perhaps a more appropriate finding that may be derived from Table 3 is that all of the cordon points are heavily utilized to an appropriate degree, with Bypass Road and the express highway system featuring prominently in waterfront truck access, and the other cordon points supplementing that access. The distribution of truck types is not uniform, however, reflecting the fact that specific industries have separate and distinct travel needs (partially observable via truck type).
The data presented in Table 1 are sums of data that were developed for each of the eight truck types defined for this study, which are discussed in detail below.
The most common truck type observed in the cordon area is the single-unit unrefrigerated box-type truck, of which two common designs are shown in Figure 3. The truck on the left has a high floor to facilitate its use at loading docks. It also has a stronger suspension, which is appropriate for heavier loads and longer trip distances. The truck on the right has a low floor and is commonly used for deliveries of bulky items like parcels, baked goods, and linens. Both type of vehicles come in a range of sizes.
Travel by these trucks into and out of the cordon area is summarized in Table 4. The three Fort Point Channel cordon points are used for 39 percent of the cordon crossings for this type of truck, the highest percentage of the eight groups and well above the 29 percent average for all trucks. This is because significant operations bases and many customer or destination concentrations for this class of trucks happen to be located across the Fort Point Channel from each other. For example, both United Parcel Service (UPS) and FedEx have distribution centers in the South Boston Waterfront, and large concentrations of customers in Boston’s central business district. Another example is the fleet of US Postal Service trucks that serve the South Station Postal Annex, many of which are garaged and maintained in the Waterfront area.
The flows of these trucks into and out of the cordon area stay roughly in balance over the course of the day, reflecting the shuttle-like nature of many distribution operations. The peaks for each direction are during the mid-morning, with 95 trucks entering and 90 leaving during a typical hour. The weakest period for truck traffic is during the evening rush hour, although staff still observed 41 of these trucks enter and leave the cordon area during this time.
FIGURE 3
Single-Unit Box-Type Trucks (Unrefrigerated)
Source: Author.
TABLE 4
Single-Unit Box-Type Trucks (Unrefrigerated)
| Cordon Point | Daily Trucks by Cordon Point: Two-way | Daily Trucks by Cordon Point: Entering | Daily Trucks by Cordon Point: Leaving | Trucks Entering Cordon During a Typical Hour: AM Peak | Trucks Entering Cordon During a Typical Hour: Mid-morning | Trucks Entering Cordon During a Typical Hour: Midday | Trucks Entering Cordon During a Typical Hour: Afternoon | Trucks Entering Cordon During a Typical Hour: PM Peak | Trucks Leaving Cordon During a Typical Hour: AM Peak | Trucks Leaving Cordon During a Typical Hour: Mid-morning | Trucks Leaving Cordon During a Typical Hour: Midday | Trucks Leaving Cordon During a Typical Hour: Afternoon | Trucks Leaving Cordon During a Typical Hour: PM Peak |
| Fort Point Channel Seaport Boulevard | 235 | 113 | 122 | 11 | 12 | 13 | 10 | 1 | 13 | 14 | 11 | 10 | 3 |
| Fort Point Channel Congress Street | 154 | 91 | 62 | 8 | 7 | 6 | 8 | 9 | 8 | 8 | 4 | 3 | 3 |
| Fort Point Channel Summer Street | 264 | 180 | 84 | 17 | 21 | 19 | 11 | 7 | 7 | 13 | 5 | 5 | 5 |
| Expressway System Turnpike Extension | 190 | 108 | 82 | 5 | 13 | 10 | 10 | 7 | 10 | 7 | 7 | 7 | 3 |
| Expressway System Williams Tunnel | 178 | 77 | 101 | 6 | 8 | 6 | 6 | 6 | 6 | 10 | 12 | 7 | 7 |
| Expressway System I-93 | 127 | 36 | 91 | 3 | 7 | 3 | 1 | 1 | 5 | 8 | 12 | 8 | 5 |
| Expressway System Bypass Road | 242 | 127 | 115 | 12 | 13 | 14 | 8 | 6 | 9 | 11 | 14 | 8 | 6 |
| South Boston A Street | 197 | 86 | 110 | 6 | 11 | 8 | 8 | 3 | 10 | 12 | 13 | 7 | 4 |
| South Boston Second Street | 41 | 0 | 41 | 0 | 0 | 0 | 0 | 0 | 2 | 3 | 3 | 5 | 4 |
| South Boston Summer St. at E. First | 53 | 22 | 31 | 0 | 3 | 3 | 2 | 1 | 1 | 4 | 6 | 1 | 1 |
| Total Trucks by Time Period | 1680 | 840 | 840 | 68 | 95 | 82 | 64 | 41 | 71 | 90 | 87 | 61 | 41 |
| Note: Second Street is one-way at the cordon. Columns may not sum exactly to column total because of rounding. | |||||||||||||
| Source: CTPS | |||||||||||||
Larger quantities of non-refrigerated goods may be transported using a semi-trailer such as the one shown in Figure 4. These trailers can be as long as 53 feet and are pulled by a tractor unit. The trailer has rear wheels only, and the front of the trailer rests on the tractor unit, which is why these are referred to as “semi-trailers.” Almost all semi-trailers are suitable for long-distance travel.
Table 5 summarizes cordon area flows for this group of trucks. The total number of these semi-trailers, 412, is only one-quarter the number of their single-unit counterparts. The expressway system including Bypass Road is used by 70 percent of trucks entering or leaving the cordon area, with Bypass Road being most heavily used, especially for entering the cordon area. The truck in Figure 4 is at the cordon entry point where Bypass Road meets Cypher Street at an intersection controlled by a signal, visible at the left.
The second-most active cordon point is the Williams Tunnel, which many of these trucks use to reach the airfreight facilities at Logan Airport, a vital link for the US Postal Service, FedEx, UPS, and various air-freight consolidators.
These trucks show a small net flow into the cordon area during the morning, and then a net outflow from midday on. By the evening peak period their numbers have dropped to 10 or 11 trucks per hour, about one-quarter of the 41 trucks during this period of their single-unit counterparts.
FIGURE 4
Box-Type Semi-Trailer (Unrefrigerated)
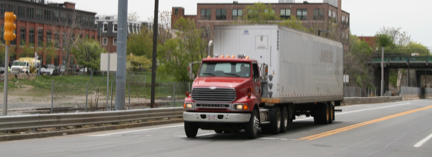
Source: Author.
TABLE 5
Box-Type Semi-Trailers (Unrefrigerated)
| Cordon Point | Daily Trucks by Cordon Point: Two-way | Daily Trucks by Cordon Point: Entering | Daily Trucks by Cordon Point: Leaving | Trucks Entering Cordon During a Typical Hour: AM Peak | Trucks Entering Cordon During a Typical Hour: Mid-morning | Trucks Entering Cordon During a Typical Hour: Midday | Trucks Entering Cordon During a Typical Hour: Afternoon | Trucks Entering Cordon During a Typical Hour: PM Peak | Trucks Leaving Cordon During a Typical Hour: AM Peak | Trucks Leaving Cordon During a Typical Hour: Mid-morning | Trucks Leaving Cordon During a Typical Hour: Midday | Trucks Leaving Cordon During a Typical Hour: Afternoon | Trucks Leaving Cordon During a Typical Hour: PM Peak |
| Fort Point Channel Seaport Boulevard | 31 | 14 | 17 | 1 | 2 | 2 | 1 | 0 | 1 | 2 | 2 | 2 | 0 |
| Fort Point Channel Congress Street | 10 | 0 | 10 | 0 | 0 | 0 | 0 | 0 | 3 | 1 | 0 | 0 | 0 |
| Fort Point Channel Summer Street | 24 | 17 | 7 | 1 | 2 | 2 | 1 | 1 | 0 | 0 | 1 | 1 | 0 |
| Expressway System Turnpike Extension | 55 | 26 | 29 | 2 | 3 | 2 | 2 | 2 | 2 | 3 | 3 | 3 | 1 |
| Expressway System Williams Tunnel | 89 | 48 | 41 | 6 | 5 | 3 | 3 | 3 | 2 | 3 | 3 | 4 | 5 |
| Expressway System I-93 | 48 | 14 | 34 | 0 | 2 | 2 | 1 | 1 | 1 | 1 | 6 | 4 | 2 |
| Expressway System Bypass Road | 98 | 67 | 31 | 6 | 8 | 8 | 4 | 2 | 3 | 4 | 4 | 1 | 1 |
| South Boston A Street | 46 | 17 | 29 | 1 | 2 | 2 | 1 | 1 | 2 | 3 | 3 | 2 | 2 |
| South Boston Second Street | 7 | 0 | 7 | 0 | 0 | 0 | 0 | 0 | 0 | 0 | 1 | 2 | 0 |
| South Boston Summer St. at E. First | 5 | 2 | 2 | 1 | 0 | 0 | 0 | 0 | 0 | 1 | 0 | 0 | 0 |
| Total Trucks by Time Period | 412 | 206 | 206 | 18 | 24 | 21 | 13 | 10 | 14 | 19 | 23 | 19 | 11 |
| Note: Second Street is one-way at the cordon. Columns may not sum exactly to column total because of rounding. | |||||||||||||
| Source: CTPS | |||||||||||||
This group of trucks probably has the most numerous vehicle style seen in the cordon area. Figure 5 shows a pair of single-unit trucks, each with a refrigeration unit appearing prominently above the driver’s cab. Unlike the non-refrigerated box-type trucks, which divide into two major styles, almost all of these trucks have high floors and heavy-duty suspensions.
As Table 6 shows, Bypass Road is by far the most important cordon point for these vehicles. These trucks traverse throughout all of New England, and 65 percent leave or enter the cordon via the expressway system, with more than half using Bypass Road.
The presence of fish processing facilities near both ends of Bypass Road is another reason for its importance. Distributors commit to delivering specific types of fish to their restaurant and retail customers, which often requires acquiring stock at multiple locations to meet clients’ needs.
These trucks show a net flow out of the cordon area from morning until afternoon. The net flow reverses in the afternoon, with a substantial number of trucks returning to the cordon area during the evening peak period, which perhaps reflects the distances associated with regional distribution.
FIGURE 5
Single-Unit Refrigerated Trucks

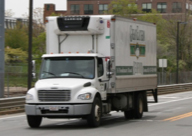
Source: Author.
TABLE 6
Single-Unit Refrigerated Trucks
| Cordon Point | Daily Trucks by Cordon Point: Two-way | Daily Trucks by Cordon Point: Entering | Daily Trucks by Cordon Point: Leaving | Trucks Entering Cordon During a Typical Hour: AM Peak | Trucks Entering Cordon During a Typical Hour: Mid-morning | Trucks Entering Cordon During a Typical Hour: Midday | Trucks Entering Cordon During a Typical Hour: Afternoon | Trucks Entering Cordon During a Typical Hour: PM Peak | Trucks Leaving Cordon During a Typical Hour: AM Peak | Trucks Leaving Cordon During a Typical Hour: Mid-morning | Trucks Leaving Cordon During a Typical Hour: Midday | Trucks Leaving Cordon During a Typical Hour: Afternoon | Trucks Leaving Cordon During a Typical Hour: PM Peak |
| Fort Point Channel Seaport Boulevard | 139 | 50 | 89 | 4 | 5 | 4 | 4 | 4 | 8 | 9 | 10 | 6 | 4 |
| Fort Point Channel Congress Street | 79 | 43 | 36 | 8 | 4 | 3 | 2 | 1 | 5 | 4 | 3 | 2 | 1 |
| Fort Point Channel Summer Street | 79 | 50 | 29 | 2 | 12 | 3 | 2 | 2 | 5 | 3 | 2 | 2 | 0 |
| Expressway System Turnpike Extension | 79 | 55 | 24 | 0 | 5 | 6 | 7 | 5 | 1 | 1 | 1 | 3 | 4 |
| Expressway System Williams Tunnel | 204 | 94 | 110 | 6 | 7 | 8 | 10 | 8 | 11 | 10 | 10 | 10 | 5 |
| Expressway System I-93 | 89 | 24 | 65 | 1 | 3 | 3 | 2 | 1 | 3 | 5 | 7 | 8 | 4 |
| Expressway System Bypass Road | 403 | 240 | 163 | 18 | 20 | 23 | 20 | 19 | 14 | 18 | 20 | 10 | 6 |
| South Boston A Street | 82 | 29 | 53 | 2 | 5 | 2 | 2 | 1 | 2 | 12 | 3 | 3 | 2 |
| South Boston Second Street | 12 | 0 | 12 | 0 | 0 | 0 | 0 | 0 | 0 | 2 | 1 | 1 | 1 |
| South Boston Summer St. at E. First | 19 | 7 | 12 | 1 | 1 | 1 | 0 | 0 | 0 | 3 | 2 | 0 | 0 |
| Total Trucks by Time Period | 1186 | 593 | 593 | 42 | 62 | 53 | 49 | 41 | 49 | 67 | 59 | 45 | 27 |
| Note: Second Street is one-way at the cordon. Columns may not sum exactly to column total because of rounding. | |||||||||||||
| Source: CTPS | |||||||||||||
Larger quantities of perishable goods are transported using refrigerated semi-trailers. The large refrigeration units are located at the front of the trailer, as shown in Figure 6. Refrigerated products are often transported for long distances, and the tractor unit in Figure 6 has an aerodynamic fairing above the cab that reduces drag and can achieve significant fuel economies on long trips.
The importance of the expressway cordon points for these trucks is apparent in Table 7. Eighty-four percent of these trucks—the highest percentage of the eight groups—leave or enter the cordon area via the expressway system. As with the refrigerated single-unit counterparts, more than half of these use Bypass Road.
This truck group illustrates another advantage of Bypass Road for waterfront access. Bypass Road connects with I‑93 and some nearby industrial locations at an intersection complex that requires passing through one or more signals. Yet far more trucks use Bypass Road than use the direct ramps to and from I‑93. Almost twice as many trucks leave via Bypass Road than via the direct I‑93 ramp that goes both north and south. The I‑93 ramps connect with the busy intersection of B and Congress Streets, whereas Bypass Road connects with an older road, the Massport Haul Road, which avoids several busy intersections on its way to the Boston Marine Industrial Park and other industrial locations.
FIGURE 6
Refrigerated Semi-Trailer
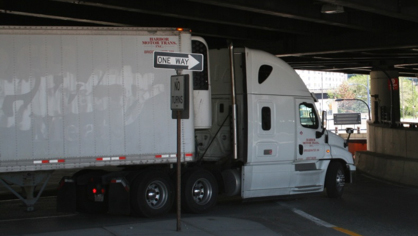
Source: Author.
TABLE 7
Refrigerated Semi-Trailers
| Cordon Point | Daily Trucks by Cordon Point: Two-way | Daily Trucks by Cordon Point: Entering | Daily Trucks by Cordon Point: Leaving | Trucks Entering Cordon During a Typical Hour: AM Peak | Trucks Entering Cordon During a Typical Hour: Mid-morning | Trucks Entering Cordon During a Typical Hour: Midday | Trucks Entering Cordon During a Typical Hour: Afternoon | Trucks Entering Cordon During a Typical Hour: PM Peak | Trucks Leaving Cordon During a Typical Hour: AM Peak | Trucks Leaving Cordon During a Typical Hour: Mid-morning | Trucks Leaving Cordon During a Typical Hour: Midday | Trucks Leaving Cordon During a Typical Hour: Afternoon | Trucks Leaving Cordon During a Typical Hour: PM Peak |
| Fort Point Channel Seaport Boulevard | 29 | 12 | 17 | 1 | 2 | 1 | 1 | 0 | 0 | 2 | 2 | 2 | 1 |
| Fort Point Channel Congress Street | 0 | 0 | 0 | 0 | 0 | 0 | 0 | 0 | 0 | 0 | 0 | 0 | 0 |
| Fort Point Channel Summer Street | 24 | 12 | 12 | 1 | 1 | 1 | 1 | 1 | 1 | 2 | 2 | ||
| Expressway System Turnpike Extension | 55 | 22 | 34 | 3 | 2 | 2 | 1 | 1 | 2 | 2 | 3 | 3 | 4 |
| Expressway System Williams Tunnel | 46 | 24 | 22 | 0 | 2 | 3 | 4 | 1 | 1 | 1 | 3 | 3 | 1 |
| Expressway System I-93 | 41 | 10 | 31 | 0 | 1 | 1 | 1 | 1 | 1 | 2 | 3 | 3 | 4 |
| Expressway System Bypass Road | 156 | 98 | 58 | 5 | 7 | 12 | 9 | 8 | 4 | 5 | 9 | 4 | 2 |
| South Boston A Street | 0 | 0 | 0 | 0 | 0 | 0 | 0 | 0 | 0 | 0 | 0 | 0 | 0 |
| South Boston Second Street | 0 | 0 | 0 | 0 | 0 | 0 | 0 | 0 | 0 | 0 | 0 | 0 | 0 |
| South Boston Summer St. at E. First | 5 | 0 | 5 | 0 | 0 | 0 | 0 | 0 | 1 | 1 | 0 | 0 | 0 |
| Total Trucks by Time Period | 356 | 178 | 178 | 10 | 15 | 20 | 17 | 12 | 10 | 15 | 22 | 15 | 12 |
| Note: Second Street is one-way at the cordon. Columns may not sum exactly to column total because of rounding. | |||||||||||||
| Source: CTPS | |||||||||||||
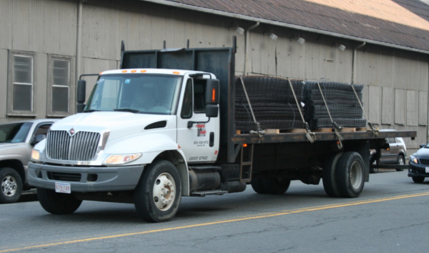
Within this catch-all group is a wide diversity of truck configurations, usually optimized for a specific commodity or task. The four examples listed in Table 2 only hint at the diversity of equipment included in this group. Figure 7 shows two relatively common trucks with a standard design: the dump truck and the flatbed truck. As with most trucks in this group, these two examples may be found in a number of sizes. The flatbed truck has removable fencing attached at the edge of the cargo area, which allows for safe movement of loose large items.
Taken altogether, there are almost as many trucks in this diverse group as there are single-unit box-type trucks, the largest group. The use of cordon points, summarized in Table 8, is also similar for these two groups, with one-third of these trucks using one of the three Fort Point Channel crossings. This may be partly because the larger service vehicles of Verizon and Comcast serve business locations from bases in the Waterfront in the same manner as UPS and FedEx vehicles.
Many of these trucks support the building trades, much of whose activities are concentrated towards the early part of the day and taper off before the evening rush hour. Interestingly, the South Boston Waterfront is both home to a number of companies in the building trades as well as the site of substantial construction activity. Considering this group altogether, however, more of these trucks are leaving the cordon area in the morning and returning in the afternoon than the other way around, which illustrates that the Waterfront provides important support to the building trades.
FIGURE 7
Single-Unit Trucks with Other Configurations
Source: Author.
TABLE 8
Single-Unit Trucks: Other Configurations
| Cordon Point | Daily Trucks by Cordon Point: Two-way | Daily Trucks by Cordon Point: Entering | Daily Trucks by Cordon Point: Leaving | Trucks Entering Cordon During a Typical Hour: AM Peak | Trucks Entering Cordon During a Typical Hour: Mid-morning | Trucks Entering Cordon During a Typical Hour: Midday | Trucks Entering Cordon During a Typical Hour: Afternoon | Trucks Entering Cordon During a Typical Hour: PM Peak | Trucks Leaving Cordon During a Typical Hour: AM Peak | Trucks Leaving Cordon During a Typical Hour: Mid-morning | Trucks Leaving Cordon During a Typical Hour: Midday | Trucks Leaving Cordon During a Typical Hour: Afternoon | Trucks Leaving Cordon During a Typical Hour: PM Peak |
| Fort Point Channel Seaport Boulevard | 192 | 86 | 106 | 9 | 9 | 11 | 5 | 2 | 17 | 9 | 9 | 5 | 4 |
| Fort Point Channel Congress Street | 91 | 41 | 50 | 3 | 3 | 3 | 3 | 5 | 7 | 6 | 3 | 3 | 2 |
| Fort Point Channel Summer Street | 240 | 173 | 67 | 12 | 13 | 15 | 15 | 17 | 11 | 7 | 7 | 2 | 1 |
| Expressway System Turnpike Extension | 130 | 67 | 62 | 5 | 5 | 5 | 9 | 4 | 7 | 7 | 5 | 5 | 2 |
| Expressway System Williams Tunnel | 178 | 82 | 96 | 10 | 7 | 7 | 7 | 3 | 6 | 8 | 8 | 9 | 9 |
| Expressway System I-93 | 101 | 26 | 74 | 4 | 3 | 2 | 1 | 1 | 6 | 7 | 9 | 7 | 2 |
| Expressway System Bypass Road | 341 | 192 | 149 | 15 | 17 | 20 | 15 | 13 | 15 | 17 | 18 | 7 | 5 |
| South Boston A Street | 178 | 84 | 94 | 11 | 9 | 6 | 6 | 3 | 7 | 12 | 7 | 7 | 6 |
| South Boston Second Street | 60 | 0 | 60 | 0 | 0 | 0 | 0 | 0 | 9 | 6 | 4 | 4 | 2 |
| South Boston Summer St. at E. First | 94 | 50 | 43 | 5 | 5 | 9 | 1 | 1 | 5 | 5 | 6 | 2 | 0 |
| Total Trucks by Time Period | 1604 | 802 | 802 | 74 | 71 | 78 | 62 | 49 | 90 | 84 | 76 | 51 | 33 |
| Note: Second Street is one-way at the cordon. Columns may not sum exactly to column total because of rounding. | |||||||||||||
| Source: CTPS | |||||||||||||
An estimated scant 316 non-box and non-refrigerated semi-trailers cross the cordon points on an average weekday—the smallest group with the exception of hazardous cargoes. As a group these types of trucks are most closely associated with the construction industry. Figure 8 shows a semi-trailer dump truck. The trailer has an integral hydraulic extender that allows the contents to be quickly unloaded while it is still connected to the tractor unit.
This type of truck is a mainstay at major construction sites and staff observed many of them supporting the construction now underway in the South Boston Waterfront. Semi-trailer flatbed trucks are also important for bringing construction supplies and transporting off-road construction vehicles to construction sites.
Table 9 shows the use of the different cordon points by these vehicles, 72 percent of which use one of the expressway cordon points. Seaport Boulevard is also an important cordon point for these trucks, probably reflecting the large amount of construction now underway on or near Seaport Boulevard.
Considering the great amount of construction now underway in the South Boston Waterfront, it is not surprising that these trucks have a net flow into the cordon area in the morning, and a net flow out in the afternoon. This is in contrast with the single-unit trucks with “other” configurations that flow out of the Waterfront in the morning, and return in the afternoon.
FIGURE 8
Semi-Trailer with Other Configuration
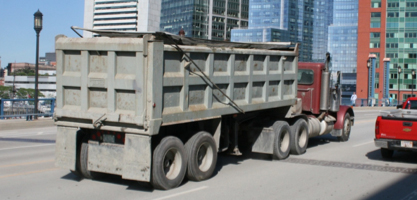
Source: Author.
TABLE 9
Semi-Trailers: Other Configurations
| Cordon Point | Daily Trucks by Cordon Point: Two-way | Daily Trucks by Cordon Point: Entering | Daily Trucks by Cordon Point: Leaving | Trucks Entering Cordon During a Typical Hour: AM Peak | Trucks Entering Cordon During a Typical Hour: Mid-morning | Trucks Entering Cordon During a Typical Hour: Midday | Trucks Entering Cordon During a Typical Hour: Afternoon | Trucks Entering Cordon During a Typical Hour: PM Peak | Trucks Leaving Cordon During a Typical Hour: AM Peak | Trucks Leaving Cordon During a Typical Hour: Mid-morning | Trucks Leaving Cordon During a Typical Hour: Midday | Trucks Leaving Cordon During a Typical Hour: Afternoon | Trucks Leaving Cordon During a Typical Hour: PM Peak |
| Fort Point Channel Seaport Boulevard | 48 | 7 | 41 | 3 | 0 | 0 | 0 | 0 | 1 | 5 | 10 | 1 | 0 |
| Fort Point Channel Congress Street | 2 | 2 | 0 | 0 | 0 | 0 | 1 | 0 | 0 | 0 | 0 | 0 | 0 |
| Fort Point Channel Summer Street | 19 | 7 | 12 | 0 | 0 | 1 | 2 | 0 | 0 | 0 | 0 | 5 | 0 |
| Expressway System Turnpike Extension | 70 | 43 | 26 | 3 | 4 | 5 | 4 | 2 | 1 | 2 | 3 | 3 | 2 |
| Expressway System Williams Tunnel | 19 | 12 | 7 | 1 | 0 | 1 | 1 | 2 | 1 | 0 | 0 | 1 | 1 |
| Expressway System I-93 | 60 | 29 | 31 | 1 | 5 | 5 | 1 | 2 | 3 | 3 | 4 | 1 | |
| Expressway System Bypass Road | 79 | 43 | 36 | 3 | 5 | 6 | 3 | 1 | 2 | 4 | 4 | 4 | 1 |
| South Boston A Street | 7 | 5 | 2 | 1 | 1 | 0 | 0 | 0 | 0 | 0 | 0 | 1 | 0 |
| South Boston Second Street | 2 | 0 | 2 | 0 | 0 | 0 | 0 | 0 | 0 | 0 | 0 | 0 | 1 |
| South Boston Summer St. at E. First | 10 | 10 | 0 | 0 | 0 | 0 | 0 | 0 | 0 | 0 | 0 | 0 | 0 |
| Total Trucks by Time Period | 316 | 158 | 158 | 12 | 15 | 22 | 12 | 5 | 7 | 14 | 20 | 19 | 6 |
| Note: Second Street is one-way at the cordon. Columns may not sum exactly to column total because of rounding. | |||||||||||||
| Source: CTPS | |||||||||||||
Only 24 trucks with hazardous-cargo placards are estimated to enter or leave the cordon area over the course of a day. Figure 9 shows a truck being loaded with welding supplies at a location just outside the cordon area. Two diamond-like placards, one red and one green, appear on the side of this truck, as well as on the front and rear ends. The red placard refers to flammable cargo, in this case one of the cylinders with a compressed gas such as acetylene. The green placard indicates that a non-flammable gas such as oxygen, nitrogen, or helium is also a cargo.
When the truck is unloaded, the placards can be flipped shut. This will allow the truck to use one of the tunnels into or out of the cordon area, all of which prohibit hazardous cargoes, an example of which appears in Figure 7.
Very few tank trucks are seen in the cordon area. Single-unit tank trucks are most often seen delivering home heating oil, but during a set of Bypass Road counts performed in winter 2013−2014, staff observed few of them (home heating oil is not widely used in the cordon area). Some tank trucks, however, refuel heavy equipment working at construction sites. The few observations of trucks of any configuration with hazardous cargoes are summarized in Table 10.
FIGURE 9
Truck Displaying Hazardous Cargo Placards

Source: Author.
TABLE 10
Hazardous Cargoes
| Cordon Point | Daily Trucks by Cordon Point: Two-way | Daily Trucks by Cordon Point: Entering | Daily Trucks by Cordon Point: Leaving | Trucks Entering Cordon During a Typical Hour: AM Peak | Trucks Entering Cordon During a Typical Hour: Mid-morning | Trucks Entering Cordon During a Typical Hour: Midday | Trucks Entering Cordon During a Typical Hour: Afternoon | Trucks Entering Cordon During a Typical Hour: PM Peak | Trucks Leaving Cordon During a Typical Hour: AM Peak | Trucks Leaving Cordon During a Typical Hour: Mid-morning | Trucks Leaving Cordon During a Typical Hour: Midday | Trucks Leaving Cordon During a Typical Hour: Afternoon | Trucks Leaving Cordon During a Typical Hour: PM Peak |
| Fort Point Channel Seaport Boulevard | 5 | 0 | 5 | 0 | 0 | 0 | 0 | 0 | 1 | 0 | 0 | 1 | 0 |
| Fort Point Channel Congress Street | 2 | 2 | 0 | 0 | 0 | 0 | 0 | 1 | 0 | 0 | 0 | 0 | 0 |
| Fort Point Channel Summer Street | 0 | 0 | 0 | 0 | 0 | 0 | 0 | 0 | 0 | 0 | 0 | 0 | 0 |
| Expressway System Turnpike Extension | 0 | 0 | 0 | 0 | 0 | 0 | 0 | 0 | 0 | 0 | 0 | 0 | 0 |
| Expressway System Williams Tunnel | 0 | 0 | 0 | 0 | 0 | 0 | 0 | 0 | 0 | 0 | 0 | 0 | 0 |
| Expressway System I-93 | 0 | 0 | 0 | 0 | 0 | 0 | 0 | 0 | 0 | 0 | 0 | 0 | 0 |
| Expressway System Bypass Road | 12 | 7 | 5 | 1 | 0 | 1 | 1 | 0 | 0 | 0 | 1 | 0 | 1 |
| South Boston A Street | 2 | 2 | 0 | 0 | 1 | 0 | 0 | 0 | 0 | 0 | 0 | 0 | 0 |
| South Boston Second Street | 2 | 0 | 2 | 0 | 0 | 0 | 0 | 0 | 0 | 0 | 1 | 0 | 0 |
| South Boston Summer St. at E. First | 0 | 0 | 0 | 0 | 0 | 0 | 0 | 0 | 0 | 0 | 0 | 0 | 0 |
| Total Trucks by Time Period | 24 | 12 | 12 | 1 | 1 | 1 | 1 | 1 | 1 | 0 | 2 | 1 | 1 |
| Note: Second Street is one-way at the cordon. Columns may not sum exactly to column total because of rounding. | |||||||||||||
| Source: CTPS | |||||||||||||
About one-tenth of the trucks entering or leaving the cordon area are ocean shipping containers. Ocean containers of the type shown in Figure 10 bear a superficial resemblance to box-type semi-trailers. They are distinct, however, in that they have no wheels and must be placed on a chassis with a set of rear wheels and a standard connecting system that would allow them to be attached to a tractor unit. Containers can be lifted on to or off of the chassis by various types of lift equipment, but every ocean container has a standard set of lifting holes at each corner that allows it to be handled by all lifting equipment worldwide. These lifting holes, clearly visible in Figure 10, are at the top and bottom of reinforced corner posts that permit containers to be stacked on ships and on land.
Almost all ocean containers crossing a cordon point either began or will end their trips at Massport’s Paul W. Conley Container Terminal (see Table 11). The operating hours, access improvements, and modernization plans for Conley Terminal affect the numbers and travel patterns of containers at the cordon points.
FIGURE 10
Ocean Shipping Container
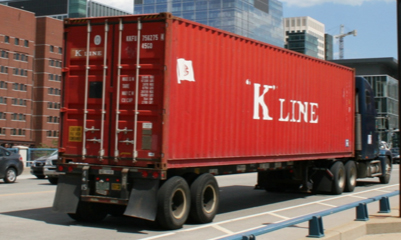
Source: Author.
TABLE 11
Ocean Shipping Containers
| Cordon Point | Daily Trucks by Cordon Point: Two-way | Daily Trucks by Cordon Point: Entering | Daily Trucks by Cordon Point: Leaving | Trucks Entering Cordon During a Typical Hour: AM Peak | Trucks Entering Cordon During a Typical Hour: Mid-morning | Trucks Entering Cordon During a Typical Hour: Midday | Trucks Entering Cordon During a Typical Hour: Afternoon | Trucks Entering Cordon During a Typical Hour: PM Peak | Trucks Leaving Cordon During a Typical Hour: AM Peak | Trucks Leaving Cordon During a Typical Hour: Mid-morning | Trucks Leaving Cordon During a Typical Hour: Midday | Trucks Leaving Cordon During a Typical Hour: Afternoon | Trucks Leaving Cordon During a Typical Hour: PM Peak |
| Fort Point Channel Seaport Boulevard | 98 | 84 | 14 | 4 | 8 | 9 | 12 | 2 | 0 | 3 | 1 | 1 | 1 |
| Fort Point Channel Congress Street | 5 | 5 | 0 | 0 | 1 | 0 | 1 | 0 | 0 | 0 | 0 | 0 | 0 |
| Fort Point Channel Summer Street | 19 | 17 | 2 | 1 | 2 | 3 | 1 | 0 | 0 | 1 | 0 | 0 | 0 |
| Expressway System Turnpike Extension | 79 | 53 | 26 | 2 | 6 | 6 | 8 | 0 | 0 | 3 | 4 | 4 | 0 |
| Expressway System Williams Tunnel | 48 | 19 | 29 | 3 | 3 | 1 | 1 | 0 | 0 | 4 | 4 | 4 | 0 |
| Expressway System I-93 | 204 | 0 | 204 | 0 | 0 | 0 | 0 | 0 | 0 | 23 | 32 | 25 | 5 |
| Expressway System Bypass Road | 187 | 149 | 38 | 10 | 18 | 19 | 13 | 2 | 1 | 4 | 5 | 5 | 1 |
| South Boston A Street | 12 | 0 | 12 | 0 | 0 | 0 | 0 | 0 | 0 | 1 | 2 | 2 | 0 |
| South Boston Second Street | 0 | 0 | 0 | 0 | 0 | 0 | 0 | 0 | 0 | 0 | 0 | 0 | 0 |
| South Boston Summer St. at E. First | 0 | 0 | 0 | 0 | 0 | 0 | 0 | 0 | 0 | 0 | 0 | 0 | 0 |
| Total Trucks by Time Period | 652 | 326 | 326 | 20 | 38 | 38 | 36 | 4 | 1 | 39 | 48 | 41 | 7 |
| Note: Second Street is one-way at the cordon. Columns may not sum exactly to column total because of rounding. | |||||||||||||
| Source: CTPS | |||||||||||||
The 2015 South Boston Waterfront Sustainable Transportation Plan cited earlier in this report measured peak-period traffic volumes and conditions both within the South Boston Waterfront and at some of the nearby gateways. With development still less than half built out, there is little available peak-period roadway capacity; during the afternoon peak period, some locations have none.
Even if expanded transit services are added to the Waterfront to accommodate future travel growth, we still would anticipate some increase in vehicular traffic. Going forward, it may be possible to add new roadway capacity or better allocate capacity on existing roadways. But if traffic growth does exceed capacity growth, the result would be peak-period queues entering or leaving the South Boston Waterfront that are longer than those occurring now.
In many parts of the regional road network, congestion affects trucks and light vehicles in tandem: deteriorating service levels hurt both; improvements help both. In a localized area like the South Boston Waterfront that is heavily dependent on truck-borne commerce, implications for trucks and light vehicles can be distinct.
The Sustainable Transportation Plan calculated that the parts of the road network with the most remaining peak-period capacity were streets that connect the South Boston Waterfront with the South Boston residential neighborhood. Trucks, in most instances, are not allowed to use these streets, and the important truck cordon points are the locations that have already run out of spare capacity, or are expected to do so in the future.
The South Boston Waterfront also exhibits the normal pattern where PM peak congestion is more severe than during the AM peak period. As shown in Table 1, truck commerce starts early, stays strong through midday, and then drops off significantly, allowing most of the truck traffic to avoid PM peak-period congestion. If, in the future, traffic increases more than capacity, then peak-period queues will start earlier and end later. This has the potential to ensnarl much of the mid-afternoon truck traffic in congestion that it now avoids.
The Sustainable Transportation Plan recommended several near- and longer-term actions, including:
The strategy to partially open Bypass Road to general traffic requires regulatory review; and allowing general traffic during the PM peak period would require some kind of solution to the Frontage Road/Southampton Street merge problem at the Southeast Expressway. These actions would end the privileged access to Bypass Road that trucks currently enjoy, and would result in some degree of real or perceived degradation in level of service.
However, significant numbers of trucks experience severe peak-period congestion at other locations that currently are used by general traffic. It is possible that reduction of congestion at non-Bypass Road locations could provide more congestion relief than any added delay that Bypass Road might experience by opening it to general traffic. This study does not offer a recommendation, but the detailed cordon data that it provides may be used to inform any analysis of this proposed action.
Conley Container Terminal is a regional port facility. Container ships from Europe and Asia make regular scheduled stops at Conley, off load a portion of their containers, load a similar number of containers, and depart for their next port.
The containers are placed on wheeled chassis, connected to a tractor, and hauled to a final destination somewhere in New England. For the reciprocal move, containers, either loaded with goods for export or, in many instances empty, are driven to Conley terminal. They are removed from the chassis and stored until their scheduled departure, at which time they are lifted onto the container ship bound overseas. There is no rail service to Conley Terminal, so trans-shipment by rail to distant North American destinations is not possible, hence the characterization of Conley as a “regional” port.
The approach channel to Conley Terminal will be deepened over the next few years to accommodate larger container vessels, many of which will come from Asia via the expanded Panama Canal. Larger container ships will not increase container traffic per se. The ships that will stop at Conley in the future will still only drop off or pick up containers with regional destinations or origins. However, strong growth is projected for worldwide container shipping, and the port of Boston must be able to serve larger vessels in order to participate fully in this growth.
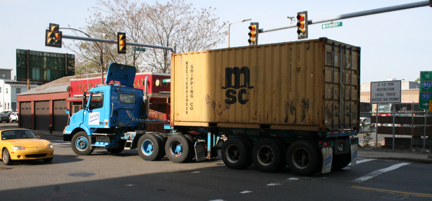
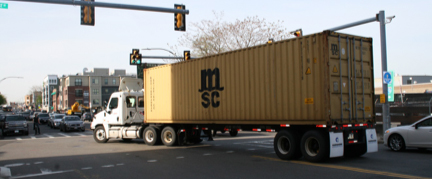
Today all trucks serving Conley Terminal must use East First Street, turning at Summer Street and traveling through the Waterfront area to use one of the cordon points. Figure 11 shows the three types of trucks that serve Conley’s container operations. All three are semi-trailers that turn from Summer Street to East First Street to approach Conley Terminal, now Conley’s only access path. At the time of tabulation, this intersection was only a cordon point for trucks like the one shown in Figure 7 entering or leaving the South Boston residential neighborhood. However, staff also counted the trucks entering or leaving Conley in order to differentiate further the truck types that serve the container terminal.
At the top of Figure 11 is a picture of a 20-foot ocean container being transported on a short chassis. The volume of container port operations and the sizes of container ships are denominated in twenty-foot-equivalent units (TEUs). The middle photo in Figure 11 shows the more typical 40-foot container, which is counted as two TEUs.
As shown in Table 11, an estimated 326 ocean containers entered the cordon area on a typical day during the time period of the field counts, and an equivalent number left the cordon area, for a total of 652 ocean containers. Of these, 146 were 20-foot containers and 506 were 40‑foot containers. Counting the 40-foot containers as two TEUs gives a total of 1,158 TEUs entering or leaving Conley Terminal, or an average of 1.78 TEU per truck hauling an ocean container.
Conley Terminal operates on weekdays, with truck arrivals allowed between 8:00 AM and 4:15 PM. Assuming 250 workdays per year excluding holidays, if the weekday rate of 652 trucks were sustained for an entire year, a total of 289,500 TEUs would be trucked into or out of Conley Terminal. Conley Terminal handled a record 247,000 TEUs in 2016, which illustrates that containerized transportation does not happen at an even pace over the course of a year. Massport staff pointed out that containers arriving in August are bringing goods for the holiday shopping season. With the anticipated growth in ocean shipping, the volumes observed during this study will be commonplace in a few years.
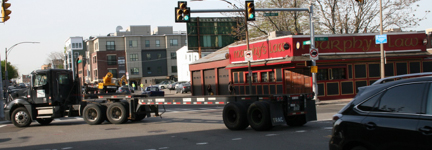
At the bottom of Figure 11 is an image of an empty chassis being moved from a storage lot in the Waterfront area to Conley Terminal, where it can be loaded with a container for transport to a regional destination. Most empty chassis stay within the South Boston Waterfront. The few chassis observed at cordon points were classified as semi-trailers with “other” configurations. About 50 empty chassis were observed going to and coming from Conley Terminal each day.
FIGURE 11
Trucks Going to Conley Terminal via East First Street
Source: Author.
As the photos in Figure 11 show, Conley truck traffic is not easily accommodated at the intersection of Summer and East First Streets. A new access road, the Dedicated Freight Corridor (DFC)—which will have a separate signalized intersection at Summer Street—is now under construction (see Figure 1). The number of ocean containers using the DFC and Summer Street will continue to grow but will no longer have an impact on local traffic at East First Street. Also, Conley Terminal is proposed to be modernized in the future, and increased on-terminal space for chassis storage should reduce the need to shuttle chassis between the main terminal and off-site storage facilities.
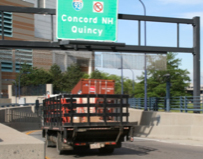
Almost all containers that leave Conley Terminal will be transported to a destination outside the cordon area. Table 11 shows that 204 of the 326 containers leaving the cordon area each day, or 63 percent, will leave using the direct entrance ramp to I-93.
The importance of this entrance ramp is shown clearly in Figure 7, in which a flatbed truck, as well as one of the numerous ocean containers, is shown entering on this ramp that leads to “Quincy” or “Concord NH.” With connections to US 1 in the north, Routes 3 and 24 to the south, and I‑95 in both directions, this ramp leads directly to most destinations in eastern Massachusetts and upper New England. Bypass Road is a distant second choice for containers leaving the cordon area.
Only 26 ocean containers leave the cordon area by the westbound entrance ramp to the I-90 Turnpike Extension. Ocean containers destined for New England have the option of entering the United States at a container terminal in New Jersey and then being trucked to Massachusetts. There are locations in central Massachusetts where the costs and convenience of shipping through Boston and New Jersey are roughly comparable. The closer the destination is to New York, the less probable it is that the container would be shipped through Boston, unless Boston offers a competitive advantage such as better service and/or more competitive costs.
Ocean containers coming to Conley Terminal use different cordon locations than those leaving. No containers use the direct ramp from I-93 into the Waterfront. This ramp only serves traffic coming from the south, and brings vehicles to a busy intersection in a non-industrial part of the South Boston Waterfront. The most popular inbound route for these containers is Bypass Road, which avoids the worst intersections and connects with alternate paths within the Waterfront.
All containers coming from the south on I-93 will use Bypass Road. Containers approaching from the north on I-93 can either exit I-93 in the financial district and enter the Waterfront on Seaport Boulevard or Summer Street, or continue south to Bypass Road. Given the lack of a direct connection from the north, staff observed that 53 trucks found the Turnpike Extension to be the best approach to Conley Terminal, as 53 is twice the number of trucks that left Conley via the Extension.
To understand Conley Terminal’s regional market better, staff conducted a gate survey over a two-day period in August, 2015. On one day, a tabulator asked every driver bringing a container into the terminal from what city the container was picked up. One a second day, the counter asked every driver taking a container out of the terminal to what city it was being taken.
During these two days, a total of 692 containers were observed, which implies that an average of 346 containers entered and left each day. A factor of 1.78 TEUs per truck and 250 operating days yields a total of 308,000 TEUs into and out of Conley Terminal if this rate were sustained for an entire year; which is slightly higher than the 289,500 TEU annual run rate estimated earlier in the study as part of the cordon analysis.
The responses of the surveyed drivers are shown graphically in Figure 12.The size of each dot reflects the number of daily containers serving that location during the survey. For example, the largest dot represents 26 containers delivered in New Hampshire. It is also assumed that 26 containers were hauled from New Hampshire to Conley Terminal.
FIGURE 12
Locations Served by Conley Terminal Ocean Containers
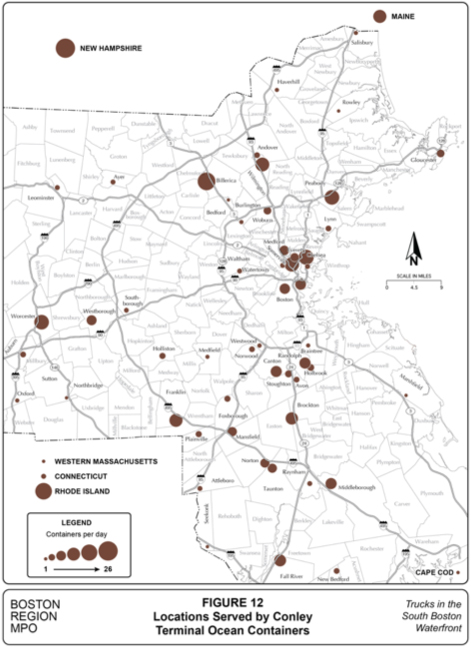
The truck movements shown in Figure 12 are a valuable resource for quantifying regional truck traffic. However, for understanding industrial logistics and port competition, these data tell only part of the story. The first problem is that the drivers were asked only where their trip with the container would end. Sometimes a container’s end can be with the freight customer, and other times it could go to a yard owned by the drayage company, and be hauled to the final customer later.
The gate survey did not present an opportunity to question drivers in detail. Of the few who were asked, some said they were going to final customers. Drivers taking the container to a drayage yard often remarked that the dispatcher would tell them where to go the next day. Valuable details about the nature of the haul were lacking for containers both arriving and leaving.
Given that many of the dots in Figure 12 represent intermediate stops rather than final customers, Figure 12 may not represent the full geographical extent of shipping through Conley Terminal. The occasional comments from drivers suggest that some drayage yards are located in some of the municipalities with larger dots, some close-in and some suburban. Representing these containers at their final destinations might result in a more numerous and perhaps more extensive constellation of smaller dots.
It is safe to conclude that relatively few of Conley’s containers would originate in or be destined for locations to the west of the area depicted in Figure 12; but it is harder to determine how competitive Conley Terminal is within the same area. To answer this question would require knowledge of the Massachusetts customer locations of containers shipped through New York area ports. As these numbers are not known, it is possible only to speculate on the fraction of ocean containers used in eastern Massachusetts that enter or leave the US through New York area ports.
Virtually all of Massachusetts is closer to Conley Terminal than to the New York area port facilities. The advantages that shippers might realize by shipping through Port Newark could include lower rates, more frequent container ship service, or service to more overseas ports. Lower rates can result from either economies of scale or competition by a greater number of shipping lines.
Massport is undertaking a multi-year project to deepen the berths and shipping channels serving Conley Terminal in order to accommodate the larger classes of container ships that will begin using the expanded Panama Canal. International container shipping is fiercely competitive and the capability of bringing larger vessels to Conley Terminal can reasonably be expected to result in lower container shipping rates. Other ports are also investing in response to the Panama Canal expansion, and the long-range impact on Conley Terminal’s competitive position is difficult to predict.
Container shipments through New York area port facilities usually enter or leave Massachusetts at Sturbridge on I-84. Within Massachusetts, these container shipments from New York do have an impact on the state road system, which may be compared with the impacts of shipping through Conley Terminal.
Westborough, shown in Figure 12 near the interchange of I-90 and I-495, is the midpoint between the state line in Sturbridge and Conley Terminal, approximately 30 miles from each. Containers shipped between New York area port facilities and locations west of Westborough actually would travel less far on Massachusetts roadways than would shipments through Conley Terminal. However, most container traffic to or from Conley Terminal serves locations east of Westborough and the travel distance in Massachusetts for these destinations is clearly less than would be shipping through New York.
If Conley Terminal strengthens its competitive position, container shipments throughout New England might switch from competing ports to Boston. If container customers east of Westborough switch from New York to Conley Terminal, travel miles on Massachusetts roads would decrease. If customers west of Westborough change, the miles on Massachusetts roads would increase. Of course, shippers choose ports based upon cost and service rather than a calculation of miles traveled on Massachusetts Highways. If Boston becomes the preferred port for western and central Massachusetts, it will be because of a superior combination of costs and services.
Fish Pier is a century-old facility owned and operated by Massport. Today it is used for a mix of activities including docking facilities for the fishing fleet, fish processing and packaging, offices, a restaurant, and a conference center. Accommodating an appropriate and economically viable mix of uses at this important site is an ongoing concern of Massport’s planning staff.
Vehicular access is clearly an important factor for any existing or envisioned uses of Fish Pier. Massport recently requested MPO staff to count and classify vehicles entering and leaving Fish Pier to understand better its current traffic patterns and needs. This request was timely and allowed traffic volumes at Fish Pier to be viewed in the context of the truck volumes that were observed at the cordon locations.
On a typical October day in 2015, a total of about 800 vehicles was observed entering Fish Pier’s one entrance between 6:00 AM and 6:00 PM, and during the same period, a similar number of vehicles left Fish Pier. Of these 800, about 550 were four-wheeled vehicles, including personal autos, commercial vans, and pickup trucks. About 12 buses and 238 trucks also entered Fish Pier. Of these trucks, 184 were refrigerated, compared with 54 non-refrigerated trucks of all types. Of the refrigerated trucks, 23 percent were semi-trailers.
The numbers of trucks observed at Fish Pier may be compared with those counted at the cordon locations. As shown in Tables 5 and 7, 593 single-unit and 178 semi-trailer refrigerated trucks cross the cordon in each direction on a typical weekday, for a total of 771 refrigerated trucks. The 184 refrigerated trucks seen at Fish Pier equal 24 percent of the refrigerated trucks counted at the cordon. Because a substantial number of the 771 refrigerated trucks were carrying products other than fish, Fish Pier’s 184 refrigerated trucks would account for significantly more than 24 percent of fish-carrying trucks crossing the cordon. In contrast, the 54 non-refrigerated trucks equal only two percent of non-refrigerated trucks crossing the cordon.
Trucks serving Fish Pier are not necessarily traveling directly between the cordon line and Fish Pier. A significant number of these trucks are assumed to be making stops within the South Boston Waterfront on their way to or from Fish Pier. Studying intra-waterfront truck trips could be a worthwhile topic for further investigation and would build upon and complement the findings in this study.
The Boston Convention and Exhibition Center (BCEC) is a prominent South Boston Waterfront feature and an important trip generator. Efficient truck access is critical to the operation of modern convention centers, and the BCEC’s design has been optimized for truck access and staging.
Recent records show that on a typical weekday an average of 34 trucks makes deliveries at the BCEC, a number slightly exceeding one percent of the 3,115 trucks that enter the cordon area (see Table 1). Of these 34, 18 trucks on average bring materials for exhibitors, though the number of these shipments can vary from none to more than one hundred. The other 16 daily average truck shipments make deliveries to support building operations, notably food services. These do not vary as much as show deliveries; there is almost always some delivery each day; only occasionally does the number of building deliveries exceed 30.
Expansion of the BCEC remains under consideration, but there is no firm timeline for this. Any expansion would result in a small overall percent increase in South Boston Waterfront truck traffic. Because of the location and operational practices of the BCEC, Bypass Road is the most important BCEC access route; it would have no problem accommodating more truck deliveries to the BCEC, especially during the midday period.
The demands placed upon the transportation systems serving the South Boston Waterfront continue to increase. Commuters traveling to newly created jobs in the area are a major source of added travel demand. Likewise, residents of the area’s newly created apartment complexes traveling to jobs outside the South Boston Waterfront are also a factor in increased congestion. Further, this neighborhood is a destination in its own right; travel by visitors will only increase and place even greater demands on all passenger modes.
Sharing the roads with cars, buses, and pedestrians are the ubiquitous trucks serving both older and newer industrial sites, and freight needs of the growing commercial activity. The trucking requirements of the exhibition, hospitality, and food-service industries are considerable, and the gradual conversion of land from industrial to non-industrial uses will not reduce truck traffic to the degree that one might expect.
The transportation challenges facing the South Boston Waterfront are well known, and significant efforts are underway to develop short- medium- and long-range action items that address these challenges. This study is meant to complement other ongoing study efforts. Goals of this study include developing detailed truck data, analyzing selected freight issues, and making these resources available to local and regional planners and stakeholders.
Selected results of this study include:
It is improbable that we have seen the last major study of transportation and land use issues in the South Boston Waterfront. Trucks traffic is only one of many factors that major studies must address. We hope that the findings in this report would encourage and facilitate consideration of truck-related issues in current and future planning efforts regarding this critical and ever-changing Boston neighborhood.
1 Boston Redevelopment Authority, The Seaport Public Realm Plan, February 1999.
2 City of Boston, South Boston Transportation Study, July 2000.
3 VHB, South Boston Waterfront Sustainable Transportation Plan, January 2015.