Technical Memorandum
DATE: October 1, 2018
TO: Massachusetts Department of Transportation and the Federal Highway Administration
FROM: Boston Region Metropolitan Planning Organization Staff
RE: Boston Region MPO Baseline CMAQ Performance Plan (2018)
The Boston Region Metropolitan Planning Organization (MPO) has developed this baseline Congestion Mitigation and Air Quality Improvement (CMAQ) performance plan for the first federal performance period (2018–21) in accordance with 23 Code of Federal Regulations (CFR) Part 490.107(c)(3) and 23 US Code Part 149(l). This plan provides the following information:
The Boston Region MPO has submitted this baseline CMAQ Performance Plan for inclusion with the Massachusetts’ October 2018 Performance Management Form.
The Boston Region MPO serves 97 municipalities in eastern Massachusetts. It includes a limited maintenance area for carbon monoxide in Waltham. On April 22, 2002, the City of Waltham was redesignated as being in attainment for carbon-monoxide emissions with an EPA-approved limited maintenance plan. While the MPO is not required to perform modeling analysis for a conformity determination for carbon monoxide, the MPO is still required to provide a status report on the timely implementation of projects and programs that will reduce emission from transportation sources—so-called transportation control measures—which are included in the Massachusetts State Implementation Plan. The MPO provides this information in annual updates to its Transportation Improvement Program (TIP).
The Federal Highway Administration’s (FHWA) October 2017 applicability determination for CMAQ traffic congestion and on-road mobile source emissions measures determined that the Boston Region MPO is required to develop a CMAQ performance plan and establish two-year and four-year targets for the on-road mobile source emissions measure.1 These two-year and four-year targets will pertain to carbon monoxide emissions.
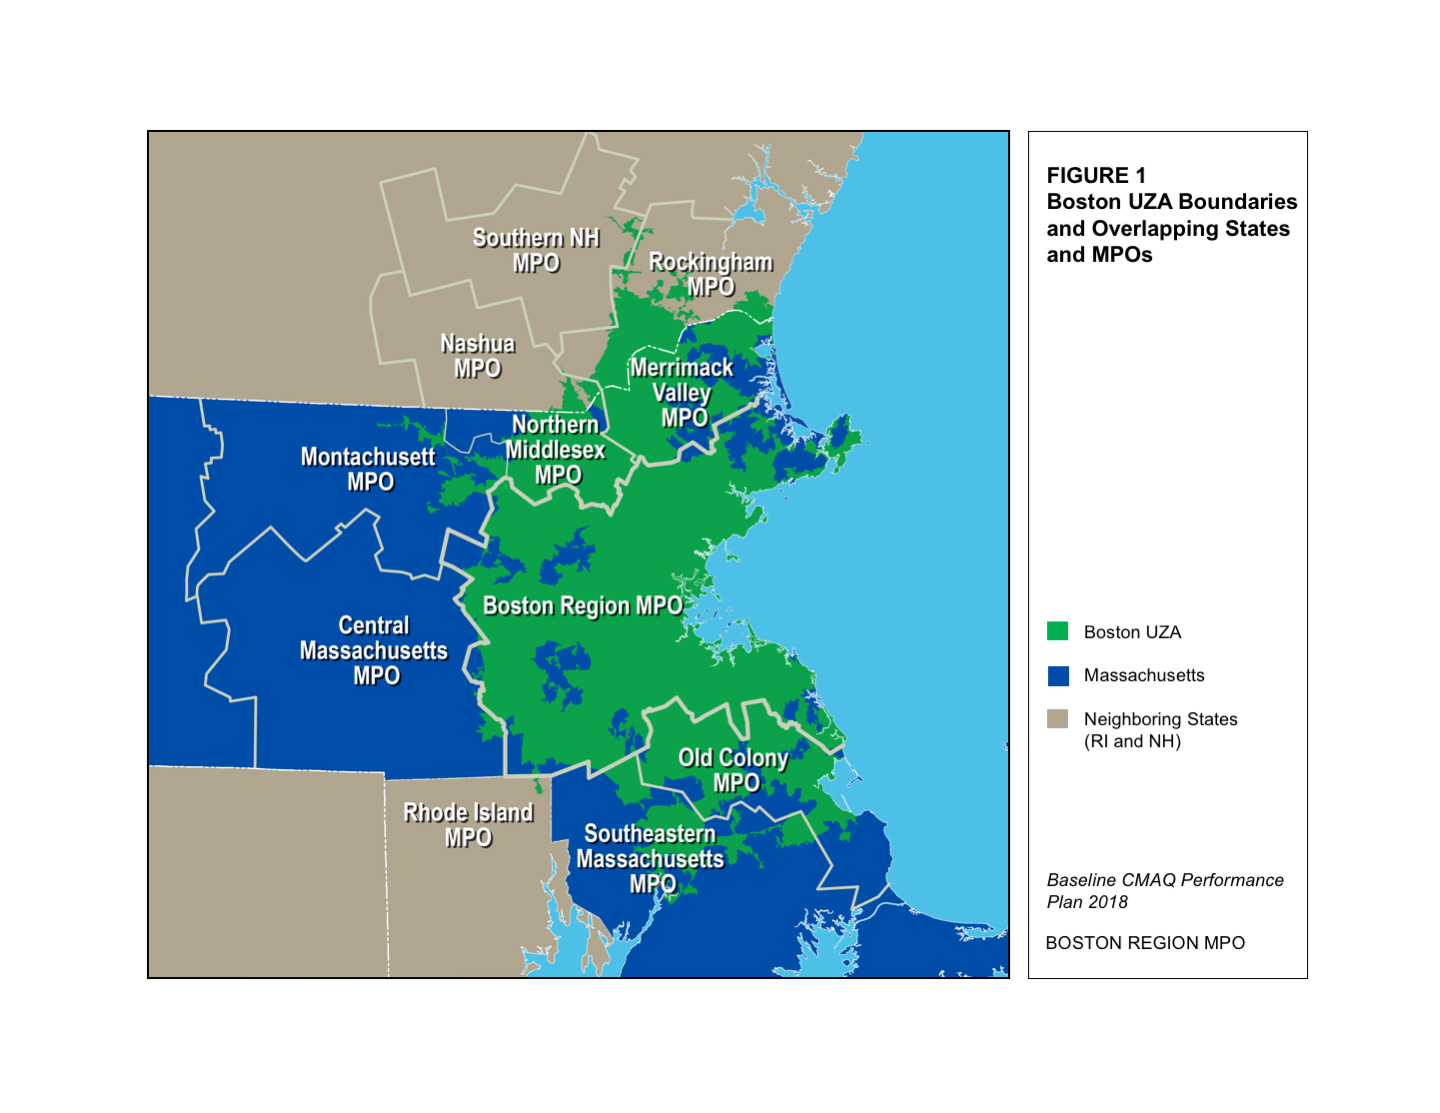
The Boston Region MPO is part of the Boston MA-NH-RI Urbanized Area (UZA), as established by the 2010 US Census. A map of the Boston MA-NH-RI UZA with a list of the states and MPOs within the UZA is shown in Figure 1. The FHWA’s October 2017 applicability determination for CMAQ traffic congestion and on-road mobile source emissions measures determined that targets for the traffic congestion measures must be established for the Boston MA-NH-RI UZA, and that the Boston Region MPO must participate in this target-setting process.2
Figure 1
Boston UZA Boundaries and Overlapping States and MPOs
The total emissions reduction measure, which addresses on-road mobile source emissions, is the cumulative estimated emission reductions for all CMAQ funded projects of each applicable criteria pollutant (ozone [03], carbon monoxide [CO], and particulate matter [PM2.5 and PM 10]) and precursor (volatile organic compounds [VOC] and oxides of nitrogen [NOx]) for which the area within the MPO is designated nonattainment or maintenance. To establish a baseline for this measure, Boston Region MPO staff reviewed listings of obligated projects and information in the CMAQ Public Access system to identify CMAQ-funded projects that would have been obligated in federal fiscal years (FFY) 2014–17. When conducting this review, MPO staff did not identify any projects that were both 1) located in Waltham and 2) funded all or in part with CMAQ dollars. As a result, MPO staff identified a baseline level of carbon monoxide emissions reduction that is equal to zero daily kilograms. This information is summarized in Table 1.
Table 1
Boston Region MPO Baseline for Total Emissions Reduction Measure
Performance Measure |
Baseline Years |
Baseline Value |
Daily kilograms of CO emissions reduction from CMAQ projects in Boston region nonattainment or maintenance areas |
FFYs 2014–17 data on obligated projects with CMAQ funding |
0 |
Note: A maintenance area for carbon monoxide is located in Waltham.
CMAQ = Congestion Mitigation and Air Quality. CO = carbon monoxide. FFY = federal fiscal year.
Source: Boston Region MPO.
FHWA established two CMAQ performance measures related to traffic congestion, which are to be measured for identified UZAs:
The Boston UZA baseline for this measure was established using 2012–16 US American Community Survey (ACS) estimates, which were the most recent five-year estimates available as of calendar year (CY) 2017.3 Massachusetts Department of Transportation (MassDOT), New Hampshire Department of Transportation (NH DOT), and MPO staff reviewed estimates of means of transportation to work for workers ages 16 and older, as outlined in ACS tables DP03 (“Selected Economic Characteristics”), S0801 (“Commuting Characteristics by Sex”), and others. The baseline for the share of non-SOV travel in the Boston UZA was developed by subtracting the estimated share of workers ages 16 and older who drove alone from 100 percent. Table 2 lists the resulting baseline value for the share of non-SOV travel for the Boston UZA, which is 33.6 percent.
Table 2
Boston UZA Baseline for Percent of Non-SOV Travel Measure
Performance Measure |
Baseline Years |
Baseline Value |
Percent of non-SOV travel |
ACS data available in 2017 |
33.6% |
ACS = US American Community Survey. CMAQ = Congestion Mitigation and Air Quality. UZA = urbanized area.
Sources: ACS.
The annual hours of PHED per capita measure estimates the expected delay experienced by a UZA’s population from travel on the National Highway System (NHS) during peak periods. MassDOT coordinated with Cambridge Systematics and NH DOT to develop a baseline estimate for this measure using the data elements outlined in Table 3.
Table 3
Data Elements for Calculating Annual Hours
of PHED Per Capita for the Boston UZA
PHED Measure Data Element |
Source for the Boston UZA |
UZA Boundary |
US Decennial Census |
UZA Population |
Population estimate for MA and NH portions of UZA, based on 2012–16 ACS block group data and expected Boston MSA population growth from 2016 to 2017 |
Reporting Segments |
2017 NPMRDS |
Travel times in 15-minute intervals |
2017 NPMRDS |
Hourly Traffic Volume |
AADT reported to the HPMS by Massachusetts and NH DOT |
Annual Vehicle Classification for Buses, Trucks, and Cars |
AADT, AADT single unit, and AADT combination unit classification data as reported to the HPMS |
Annual Vehicle Occupancy for Cars, Buses, and Trucks |
Data provided by FHWA in Average Vehicle Occupancy Factors for Computing Travel Time Reliability Measures and Total Peak Hour Excessive Delay Metrics, April 2018 |
AADT = Average Annual Daily Traffic. ACS = US American Community Survey. FHWA = Federal Highway Administration. HPMS = Highway Performance Monitoring System. MA = Massachusetts. MSA = Metropolitan Statistical Area. NH = New Hampshire. NPMRDS = National Performance Management Research Data Set. UZA = Urbanized Area.
Source: MassDOT, NH DOT, and Boston Region MPO
Table 4 lists the components of the 2017 baseline value measure, including 1) a PHED estimate that reflects the NHS network within the Boston UZA and 2) the UZA population. Using these components, MassDOT, Cambridge Systematics, and NH DOT identified a baseline value of 18.3 annual hours of PHED per capita.
Table 4
Boston UZA Baseline for Annual Hours of PHED Per Capita
MA and NH Annual PHED |
Boston UZA Population (MA and NH Only)a |
Annual PHED Per Capita for the Boston UZA |
80,053,183 |
4,371,476 |
18.3 |
a Cambridge Systematics aggregated 2012–16 ACS population estimates at the block group level to estimate the population for the portion of the UZA in Massachusetts and New Hampshire. They then inflated this estimate for 2017 by applying information on expected population growth in the Boston Metropolitan Statistical area between 2016 and 2017.
MA = Massachusetts. NH = New Hampshire. PHED = peak hour excessive delay. UZA = urbanized area.
Sources: National Performance Management Research Data Set, FHWA, MassDOT, and NH DOT.
For the first federal performance-monitoring period (2018–21), the Boston Region MPO is required to set the following targets for the total emissions reduction measure with respect to its carbon monoxide maintenance area in Waltham:
Boston Region MPO staff reviewed transportation projects programmed in its FFY 2018–22 and FFY 2019–23 TIPs to identify any that are 1) located in Waltham and 2) funded all or in part with CMAQ dollars. MPO staff did not identify any projects that met both of these criteria in its TIPs for the years FFYs 2018–21. As a result, the MPO has set its two-year and four-year carbon monoxide emissions reductions targets equal to the baseline value of zero kilograms per day. Table 5 summarizes this information.
Table 5
Boston Region MPO Emissions Reduction Targets
Performance Measure |
Baseline Years and Data |
Baseline Value |
Two-Year Target (FFYs 2018–19) |
Four-Year Target (FFYs 2018–21) |
Daily kilograms of CO emissions reduction from CMAQ projects in Boston region nonattainment or maintenance areas |
FFYs 2014–17 data on obligated projects with CMAQ funding |
0 |
0 |
0 |
Note: A maintenance area for carbon monoxide is located in Waltham.
CMAQ = Congestion Mitigation and Air Quality. CO = carbon monoxide. FFY = federal fiscal year.
Sources: Boston Region MPO.
The Boston Region MPO took action to adopt these emissions reduction performance targets on September 20, 2018.
MassDOT, NH DOT, the Boston Region MPO, and the Northern Middlesex Council of Governments (NMCOG) are required to establish the following targets for the Boston UZA for the percent of non-SOV travel measure:
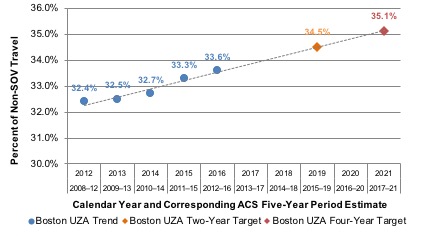
To develop these targets, MassDOT and NH DOT used a series of five ACS five-year period estimates—from 2012 (2008–12 ACS estimate) to 2016 (2012–16 ACS estimate)—to create a linear trend line. MassDOT and NH DOT then used this trend line to project ACS five-year estimates that would reflect expected conditions as of the end of CY 2019 (the expected 2015–19 ACS estimate) and as of the end of CY 2021 (the expected 2017–21 ACS estimate) (Figure 2).
MassDOT and NH DOT selected these projected values as the Boston UZA targets for the percent of non-SOV travel, and established these values as the two-year and four-year targets for the Boston UZA.
Figure 2
Historic Value and Targets for the
Percent of Non-SOV Travel in the Boston UZA
ACS = US American Community Survey. SOV = single-occupancy vehicle. UZA = urbanized area.
Sources: US Census Bureau, 2012-16 American Community Survey Five-Year Estimates; MassDOT; and NH DOT.
The Boston Region MPO is required to report UZA targets for the percent of non-SOV travel measure that are identical to those reported by MassDOT and NH DOT. The Boston Region MPO took action to adopt these targets for the percent of non-SOV travel measure on September 20, 2018. These target values are summarized in Table 6.
Table 6
Boston UZA Targets for the Percent of Non-SOV Travel Measure
CMAQ Traffic Congestion Performance Measure |
Baseline Data |
Baseline Value |
Two-Year Target (CYs 2018–19) |
Four-Year Target (CYs 2018–21) |
Percent of non-SOV travel |
ACS data available in 2017 (2012–16 estimates) |
33.6% |
34.5% |
35.1% |
ACS = US American Community Survey. CMAQ = Congestion Mitigation and Air Quality. CY = calendar year. UZA = urbanized area.
Sources: MassDOT, NH DOT, and ACS.
MassDOT, NH DOT, the Boston Region MPO, and the NMCOG are required to establish a four-year target for the annual hours of PHED per capita per measure, which reflects expected performance on this measure as of the end of CY 2021. These agencies have also opted to report a two-year target for this measure, which reflects expected performance as of the end of CY 2019.
As discussed in Section 2.2, MassDOT, Cambridge Systematics, and NH DOT coordinated with one another to process NPMRDS (National Performance Management Research Data Set) and other data to create a baseline value for the Boston UZA for the annual hours of PHED per capita per measure. They only examined NPMRDS travel-time data from CY 2017 when developing targets for the PHED measure because of the differences in features between the Version 1 and Version 2 NPMRDS data sets. When setting targets, these agencies considered guidance from FHWA to states and MPOs, which states that because there are differences between Versions 1 and 2 of the NPMRDS, using multiple years of data to set targets may not be the best approach, especially for four-year targets.4 MassDOT and NH DOT elected to set both a two-year target (reflecting performance as of the end of CY 2019) and a four-year target (reflecting performance as of the end of CY 2021) equal to the 2017 baseline value—18.3 annual hours of PHED per capita—and established these targets for the UZA.
The Boston Region MPO is required to report UZA targets for the annual hours of PHED per capita measure that are identical to those reported by MassDOT and NH DOT. The Boston Region MPO took action to adopt these targets for the annual hours of PHED per capita measure on September 20, 2018. These target values are summarized in Table 7.
Table 7
Boston UZA Targets for the Annual Hours of PHED per Capita Measure
CMAQ Traffic Congestion Performance Measure |
Baseline Data |
Baseline Value |
Two-Year Target (CYs 2018–19) |
Four-Year Target (CYs 2018–21) |
Annual hours of PHED per capita |
See details in Table 3 |
18.3 |
18.3 |
18.3 |
CMAQ = Congestion Mitigation and Air Quality. CY = calendar year. NPMRDS = National Performance Management Research Data Set. PHED = peak hour excessive delay. UZA = urbanized area.
Sources: NPMRDS, FHWA, MassDOT, NH DOT, and ACS.
Table 8 describes projects in the Boston region that were programmed to receive CMAQ funding in FFYs 2018 or are programmed to receive CMAQ funding in FFYs 2019, 2020, 2021. This table includes projects that are or have been programmed by the Boston Region MPO or by MassDOT. For each project, it provides
Because none of these projects are located in the carbon monoxide limited maintenance area in Waltham, Table 8 does not include information about expected carbon monoxide emissions reduction.
Table 8
CMAQ-funded Transportation Projects Programmed in the Boston Region
| Project Name | Project Category | Project Description | MPO Municipalities | Expected Year of CMAQ Obligation (FFY) | Relationship to Annual Hours of PHED per Capita Measure | Relationship to the Percent of Non-SOV Travel Measure |
| Green Line Extension to College Avenue with the Union Square Spur | Transit Projects | Extend the MBTA Green Line from a relocated Lechmere Station in East Cambridge to College Avenue in Medford, with a branch to Union Square in Somerville. | Multiple (Cambridge, Medford, Somerville) | CMAQ funds were first obligated in 2017. Future obligations scheduled for 2018, 2019, 2020, and 2021. | This project is not on the NHS but may reduce PHED by providing an alternative to travel on nearby NHS routes. | This project may increase non-SOV travel because it will expand a transit alternative to SOV travel. |
| Southborough: Reconstruction of Main Street (Route 30) from Sears Road to Park Street | Traffic Flow Improvement Projects | Reconstruct Main Street to include new traffic signals, improving roadway geometry and constructing sidewalks. | Southborough | 2018 | This project is not on the NHS and not expected to affect PHED on the NHS network. It is expected to help reduce delay in the project corridor. | This project may increase non-SOV travel by adding new sidewalks in the project corridor. |
| Brookline: Intersection and Signal Improvements at Route 9 and Village Square (Gateway East) | Traffic Flow Improvement Projects | Improve regional connections for bicycles and pedestrians. Signals at Washington Street/Brookline Avenue intersection will be upgraded and interconnected with new signals at the Walnut/Pearl Street intersection. | Brookline | 2018 | This project is on the NHS and may reduce PHED by improving signalization and roadway geometry. | This project may increase non-SOV travel by enhancing bicycle and pedestrian travel in the project corridor. |
| Braintree: Adaptive Signal Controls on Route 37 (Granite Street) | Traffic Flow Improvement Projects | Implement adaptive signal controls on Route 37. | Braintree | 2018 | This project is on the NHS and may reduce PHED by implementing signals that adapt to changing traffic patterns and create smoother traffic flow. | This project is not expected to increase non-SOV travel. |
| Framingham-Natick: Cochituate Rail Trail (CRT) Construction | Bicycle and Pedestrian Projects | Construct 2.4 miles of rail trail, including a spur line connecting to the Natick Mall at Speen Street, a connection to the Framingham section of the CRT, and a connection to North Main Street. | Framingham, Natick | 2018 | This project is not on the NHS and not expected to affect PHED on the NHS network. | This project may increase non-SOV travel because it will create connections in the region's bicycle and pedestrian network. |
| Needham-Newton: Reconstruction of Highland Avenue, Needham Street and Charles River Bridge, From Webster Street (Needham) to Route 9 (Newton) | Traffic Flow Improvement Projects | Reconstruct Highland Avenue, including the rehabilitation of the Charles River Bridge. The project will include geometric improvements, sidewalk reconstruction, traffic signal equipment and/or timing upgrades, and implementation of bike lanes and bike-on-shoulder accommodations. | Needham, Newton | 2019 and 2020 | This project is not on the NHS but may reduce PHED on nearby NHS routes by improving signalization and roadway geometry. | This project may increase non-SOV travel by expanding bicycle and pedestrian facilities in the project corridor. |
| Natick: Reconstruction of Route 27 (North Main Street to Wayland town line) excluding the Route 9 Interchange | Traffic Flow Improvement Projects | Reconstruct Route 27 to include minor widening to create a more consistent cross-section; construction of sidewalks on both sides of the roadway; inclusion of bicycle accommodations; upgrades of existing signals; and new signals at Lake Street, Rutledge Road, and Pine Street. | Natick | 2019 | This project is on the NHS and may reduce PHED by improving signalization and roadway geometry. | This project may increase non-SOV travel by expanding bicycle and pedestrian facilities in the project corridor. |
| Hopedale-Milford: Resurfacing and Intersection Improvements on Route 16 (Main Street) | Traffic Flow Improvement Projects | Reconstruct sidewalks and make improvements to the intersection of Route 16 and Route 140, including upgrades to signal equipment and widening where feasible. | Milford | 2019 | This project is on the NHS and may reduce PHED by improving signalization and roadway geometry. | This project may increase non-SOV travel by improving sidewalks in the project corridor. |
| Beverly: Intersection Improvements at 3 Locations: Cabot Street (Route 1A/97 at Dodge Street [Route 1A]), County Way, Longmeadow Road, and Scott Street; McKay Street at Balch Street; and Veterans Memorial Bridge (Route 1A at Rantoul, Cabot, Water, and Front Streets) | Traffic Flow Improvement Projects | Update and modernize traffic signal equipment, signalize or install a modern roundabout at the intersection of McKay Street at Balch Street, and provide ADA compliant wheelchair ramps at sidewalks at each intersection. Provide bike lanes at two of the three intersections. | Beverly | 2019 | This project includes intersections on the NHS and may reduce PHED by improving signalization and roadway geometry. | This project may increase non-SOV travel by enhancing bicycle and pedestrian travel in the project corridor. |
| Acton-Concord: Bruce Freeman Rail Trail Construction, Includes Replacing Bridge C-19-037, Rail Trail Over Nashoba Brook, New Bridge C-19-039, Rail Trail over Route 2 and New Culvert C-19-040, Route 2 Over Wildlife Crossing (Phase II-B) | Bicycle and Pedestrian Projects | Construct rail-to-trail project connecting to the existing 12 mile trail from Lowell to Acton. | Acton, Concord | 2019 | This project is not on the NHS and not expected to affect PHED on the NHS network. | This project may increase non-SOV travel because it will create connections in the region's bicycle and pedestrian network. |
| Brookline--Pedestrian Bridge Rehabilitation over MBTA off Carlton Street | Bicycle and Pedestrian Projects | Rehabilitate pedestrian bridge to restore pedestrian connection. | Brookline | 2019 | This project is not on the NHS and not expected to affect PHED. | This project may increase non-SOV travel because it will create connections in the region's pedestrian network. |
| Hopkinton: Signal and Intersection Improvements on Route 135 | Traffic Flow Improvement Projects | Implement improvements that include signal equipment additions and upgrades, geometric modifications, and reconstruction of sidewalks and wheelchair ramps. | Hopkinton | 2020 | This project is on the NHS and may reduce PHED by improving signalization and roadway geometry. | This project is not expected to increase non-SOV travel. |
| Everett: Reconstruction of Ferry Street, South Ferry Street, and a Portion of Elm Street | Traffic Flow Improvement Projects | Construct new sidewalks and the traffic signals at five locations. The signalized intersection at Chelsea Street will be replaced by a roundabout. | Everett | 2020 | This project is not on the NHS but may reduce PHED on nearby NHS routes by improving signalization. | This project is not expected to increase non-SOV travel. |
| Lynn: Reconstruction on Route 129 (Lynnfield Street) from Great Roads to Wyoma Street | Traffic Flow Improvement Projects | Implement improvements at three intersections with an emergency signal added at Broadway/Hudson Street. All signals will be coordinated. Sidewalks will be reconstructed and bicycle accommodations provided where possible on shoulders. | Lynn | 2020 | This project is on the NHS and may reduce PHED by improving signalization. | This project may increase non-SOV travel by expanding bicycle and pedestrian facilities in the project corridor. |
| Ashland: Reconstruction on Route 126 (Pond Street) from the Framingham Town Line to the Holliston Town Line | Traffic Flow Improvement Projects | Install new and/or upgraded signals with optimized signal timing and phasing. Construct bike lanes and sidewalks on both sides of the corridor. | Ashland | 2020 | This project is on the NHS and may reduce PHED by improving signalization. | This project may increase non-SOV travel by expanding bicycle and pedestrian facilities in the project corridor. |
| Walpole: Construction on Route 1A (Main Street) from the Norwood Town Line to Route 27, Includes W-03-024 Over the Neponset River | Traffic Flow Improvement Projects | Implement intersection improvements and coordinated traffic signals with optimized timings. Construct new sidewalks on both sides of the road except for the segment between Bullard/Willet Street intersection and the Norwood Town Line and provide four-foot shoulders along Route 1A for bicycle travel. | Walpole | 2020 | This project is not on the NHS but may reduce PHED on nearby NHS routes by improving signalization. | This project may increase non-SOV travel by expanding bicycle and pedestrian facilities in the project corridor. |
| Malden: Exchange Street Downtown Improvement Project | Traffic Flow Improvement Projects | Improve sidewalks, ramps, crosswalks, sidewalk extensions (bump-outs), and bicycle accommodations including an on-street bicycle lane and bicycle racks. Connections to Malden Center transit station will be provided. | Malden | 2020 | This project is not on the NHS and not expected to affect PHED on the NHS network. | This project may increase non-SOV travel by enhancing bicycle and pedestrian travel in the project corridor. |
| Boston-Brookline: Multi-Use Path Construction on New Fenway | Bicycle and Pedestrian Projects | Construct a new multi-use bike/pedestrian pathway from the Muddy River in Brookline to Maitland Street in Boston. | Boston, Brookline | 2020 | This project is not on the NHS and not expected to affect PHED on the NHS network. | This project may increase non-SOV travel by improving and expanding bicycle facilities in the project corridor. |
| Boston: Improvements on Boylston Street, from Intersection of Brookline Avenue and Park Drive to Ipswich Street | Traffic Flow Improvement Projects | Improve existing geometric layout and upgrade the signal equipment at five intersections on Boylston Street. Expand pedestrian and bicycle facilities. | Boston | 2021 | This project is on the NHS and may reduce PHED by improving signalization and roadway geometry. | This project may increase non-SOV travel by expanding bicycle and pedestrian facilities in the project corridor. |
| Norwood: Intersection Improvements at Route 1A and Upland Road/Washington Street and Prospect Street/Fulton Street | Traffic Flow Improvement Projects | Install signals and implement geometric improvements at the intersections of Route 1A. | Norwood | 2021 | This project is not on the NHS and not expected to affect PHED. | This project is not expected to increase the share of non-SOV travel. |
| Boston Region MPO Community Transportation Program | To be determined | Provide funding for projects such as first-mile/last-mile projects to transit and additional parking at transit stations. | Multiple (to be determined) | 2021 | To be determined. This assessment depends on the projects funded through this program. | To be determined. This assessment depends on the projects funded through this program. |
| Dedham: Pedestrian Improvements along Elm Street and Rustcraft Road Corridors | Bicycle and Pedestrian Projects | Improve sidewalks and implement minor roadway widening to accommodate shoulders for bicycle travel in each direction. | Dedham | 2021 | This project is not on the NHS and not expected to affect PHED. | This project may increase non-SOV travel by expanding bicycle facilities in the project corridor. |
| Wakefield-Lynnfield: Rail Trail Extension, from the Galvin Middle School to the Lynnfield/Peabody Town Line | Bicycle and Pedestrian Projects | Construct a rail trail extension, which |
Lynnfield, Wakefield | 2021 | This project is not on the NHS and not expected to affect PHED. | This project may increase non-SOV travel because it will create connections in the region's bicycle and pedestrian network. |
| ADA = Americans with Disabilities Act. CMAQ = Congestion Mitigation and Air Quality. CRT = Cochituate Rail Trail. FFY = federal fiscal year. MBTA = Massachusetts Bay Transportation Authority. MPO = Metropolitan Planning Organization. NHS = National Highway System. PHED = peak hour excessive delay. SOV = single occupancy vehicle. | ||||||
Questions pertaining to this CMAQ Performance Plan can be addressed to Michelle Scott or Anne McGahan of Boston Region MPO staff. Staff contact information is available at ctps.org/ctps_staff.
1 FHWA, “Applicability Determination: CMAQ Traffic Congestion and CMAQ On-road Mobile Source Emissions Measures,” https://www.fhwa.dot.gov/environment/air_quality/cmaq/measures/cmaq_applicability/cmaqaqpplicability2018.pdf, accessed September 16, 2018, page 13.
2 Ibid, pg. 27 and 34.
3 United States Census Bureau, “American Community Survey: 2012–16 ACS Five-Year Estimates,” December 12, 2017, https://www.census.gov/programs-surveys/acs/technical-documentation/table-and-geography-changes/2016/5-year.html, accessed September 16, 2018.
4 FHWA, “Frequently Asked Questions: Target Setting,” https://www.fhwa.dot.gov/tpm/faq.cfm#targ, accessed September 14, 2018.