Project Manager
Betsy Harvey
Project Principal
Lourenço Dantas
Data Analyst
Paul Reim
Graphics
Kim DeLauri
Ken Dumas
Cover Design
Kim DeLauri
The preparation of this document was supported by the Federal Highway Administration through MPO 3C PL contract #95411 and the Federal Transit Administration through §5303 contract #98873.
Central Transportation Planning Staff
Directed by the Boston Region Metropolitan Planning Organization. The MPO is composed of state and regional agencies and authorities, and local governments.
June 2017
Contact Information
Certification of the Boston Region MPO Transportation Planning Process
Abstract
Executive Summary
CHAPTER 1 - Background and Purpose
CHAPTER 2 - General Reporting Requirements
CHAPTER 3 - Requirements Specific to MPOs
CHAPTER 4 - Equity and the MPO's Planning Process
The Boston Region Metropolitan Planning Organization (MPO) complies with Title VI of the Civil Rights Act of 1964, the Americans with Disabilities Act (ADA), and other federal and state nondiscrimination statutes and regulations in all programs and activities. The MPO does not discriminate on the basis of race, color, national origin, English proficiency, income, religious creed, ancestry, disability, age, gender, sexual orientation, gender orientation, gender identity or expression, or military service.
Any individual who believes that he or she, or any specific class of persons, has been subjected to discrimination or retaliation, as prohibited by Title VI of the Civil Rights Act of 1964, as amended, and related federal and state statutes, by the Boston Region MPO in its role of planning and programming federal funds may file a written complaint. Complaints filed under a federal law—on the basis of race, color, national origin, language, sex, age, disability, or income—must be filed no later than 180 calendar days after the date on which the person believes the discrimination occurred. Complaints filed under a Massachusetts General Law—on the basis of religion, military service, ancestry, sexual orientation, or gender identity or expression—must be filed no later than 300 calendar days after the date on which the person believes the discrimination occurred.
To request additional copies of this document or to request it in an accessible format, please contact MPO staff using the methods described below. It is also possible to download the document by visiting www.bostonmpo.org.
CONTACT MPO STAFF:
By mail:
Betsy Harvey
Transportation Equity Program Manager,
Central Transportation Planning Staff
10 Park Plaza, Suite 2150
Boston, MA 02116
By telephone:
857-702-3701 (voice); 617-570-9193 (TTY)
By fax:
617-570-9192
By email:
This document was funded in part through grants from the Federal Highway Administration and Federal Transit Administration of the U.S. Department of Transportation. Its contents do not necessarily reflect the official views or policies of the U.S. Department of Transportation.
To request additional copies of this document or copies in an
accessible format, contact:
Central Transportation Planning Staff
State Transportation Building
Ten Park Plaza, Suite 2150
Boston, Massachusetts 02116
(857) 702-3700
(617) 570-9192 (fax)
(617) 570-9193 (TTY)
ctps@ctps.org
Boston Region Metropolitan Planning Organization
June 2017
Prepared by
Central Transportation Planning Staff
Staff to the Boston Region Metropolitan Planning Organization
Directed by the Boston Region Metropolitan Planning Organization, which is composed of the:
Massachusetts Department of Transportation
Metropolitan Area Planning Council
Massachusetts Bay Transportation Authority
MBTA Advisory Board
Massachusetts Port Authority
Regional Transportation Advisory Council
City of Boston
City of Beverly
City of Everett
City of Newton
City of Somerville
City of Woburn
Town of Arlington
Town of Bedford
Town of Braintree
Town of Framingham
Town of Lexington
Town of Medway
Town of Norwood
Federal Highway Administration (nonvoting)
Federal Transit Administration (nonvoting)
CERTIFICATION OF THE BOSTON REGION MPO TRANSPORTATION PLANNING PROCESS
In accordance 49 CFR Section 21.7(a), every applicant for federal financial assistance from the U.S. Department of Transportation (USDOT) must provide assurance that the applicant will carry out the activity in compliance with DOT’s Title VI regulations. As the Boston Region MPO receives financial assistance from the Federal Highway Administration (FHWA) and Federal Transit Administration (FTA), the MPO submits assurances for both agencies. For the FTA, this requirement is satisfied when the applicant submits its annual certifications and assurances to the FTA. For FHWA, this requirement is satisfied when the applicant submits its annual assurances to FHWA. Assurances and certifications for the FTA and FHWA fare linked below.
FTA FY 2017 Certifications and Assurances
Title VI Nondiscrimination Assurance
Title VI of the Civil Rights Act of 1964 states that “no persons in the United States shall, on the ground of race, color, or national origin, be excluded from participation in, be denied the benefits of, or be subject to discrimination under any program or activity receiving federal financial assistance.” To fulfill this mandate, each federal agency that provides financial assistance to any recipient is authorized and directed by the United States Department of Justice to apply Title VI to each recipient by issuing applicable requirements. As federal agencies, the Federal Transit Administration (FTA) and Federal Highway Administration (FHWA) require that recipients of their financial assistance have Title VI programs and document these programs and related activities.
As a subrecipient of both FTA and FHWA funding, the Boston Region Metropolitan Planning Organization (MPO) has prepared this 2017 Triennial Title VI Report that explains its Title VI program. The program, conducted in cooperation with the Massachusetts Department of Transportation (MassDOT), is consistent with the principles, federal laws and guidelines, and related requirements of Title VI, and is responsive to the needs of beneficiaries.
The Boston Region Metropolitan Planning Organization (MPO) is responsible for conducting the federally required metropolitan transportation-planning process (often called the 3C—continuing, cooperative, and comprehensive—process) for the Boston metropolitan area. The MPO uses this process to develop a vision for the region and then decides how to allocate federal and state transportation funds to programs and projects—roadway, transit, bicycle, and pedestrian—that support this vision. To perform the 3C planning process, the MPO receives funding from both the Federal Transit Administration (FTA) and Federal Highway Administration (FHWA).1
As a recipient of this federal funding, the MPO is required to comply with various civil rights statutes, executive orders, and regulations that are intended to ensure that traditionally underserved populations are included in the planning process and have access to MPO activities. The primary civil rights authorities include:
Both the FTA and FHWA require the MPO to comply with these civil rights mandates by developing programs to include underserved populations, and monitoring and reporting regularly on the programs’ success. The MPO’s compliance efforts are fulfilled under its Title VI and Transportation Equity (TE) programs, which address the transportation needs of populations protected under the mandates discussed above, analyze the effects of the MPO’s activities, and perform public outreach. The Title VI program, which focuses specifically on Title VI requirements, is a part of the broader TE program, which identifies and addresses the concerns of EJ and other traditionally underserved populations, including those protected on the basis of age, sex, and disability. In addition to these programs, consideration of equity is integral to all aspects of the MPO planning process.
This report addresses the FTA’s triennial reporting requirements under Title VI of the Civil Rights Act of 1964 and FHWA’s annual reporting requirements under its Title VI/non-discrimination program. The report reflects the MPO’s efforts over the past three years (since its prior Title VI report) to identify the specific transportation concerns and needs of populations protected under the above legal authorities. The MPO believes that these efforts are vital not only because they comply with federal regulations, but also because they are sound transportation-planning practices that further the MPO’s vision of providing equitable transportation access and involvement in its decision-making process to all residents in the region regardless of their background.
As part of their Title VI reporting processes, all recipients of federal funding, including MPOs, must provide the following documentation, all of which is included in this report.
For reporting purposes, the MPO is required to collect data and complete various analyses to evaluate the impact of its planning activities on protected populations. This includes analyzing demographic characteristics of protected populations, analyzing how the MPO’s transportation investments are distributed, and determining whether projects funded by the MPO cause disparate impacts or disproportionate burdens to minority and low-income populations, respectively.
To meet FTA Title VI requirements, the MPO has produced demographic profiles—a collection of maps and tables—of minority and LEP populations. In response to FHWA broader requirements, the MPO also has developed demographic profiles for other protected populations, including low-income, elderly, people with disabilities, zero-vehicle households, and female-headed households with children.
MPO staff produced an analysis and map of the geographical distribution of projects in the federal fiscal years (FFYs) 2017–2021 Transportation Improvement Program (TIP). The analysis reviews the distribution of MPO target-funded projects that serve transportation analysis zones (TAZs) that exceed regional thresholds for TE populations. The map shows location-specific public transit projects in the TIP. In the FFYs 2012–2021 TIP, staff also analyzed distribution of state and federal funds for public transit projects to low-income, non-low-income, minority and non-minority passengers. This analysis determined the amount of investments per transit passenger, relative to ridership.
For the FFYs 2017 and 2018 Unified Planning Work Programs (UPWP), the MPO produced a geographical assessment of the distribution of MPO-funded studies. It cites which communities in the region have been the subject of these studies, as well as their low-income and minority composition.
The MPO analyzes all of the proposed projects, in the aggregate, in its Long-Range Transportation Plan (LRTP) to identify potential impacts—called disparate impacts for minority populations and disproportionate burdens for low-income populations. In addition, the MPO recently developed a methodology to do a similar analysis for the TIP. The goal for both analyses is to determine whether the collection of projects would cause disparate impacts or disproportionate burdens for minority and low-income populations. In the process of doing so, the MPO has developed a draft disparate impact/disproportionate burden (DI/DB) policy that, while not explicitly required by the FTA and FHWA, sets thresholds that allow the MPO to determine whether a collection of projects would cause disparate impacts and/or disproportionate burdens.
The MPO’s most recent LRTP, Charting Progress to 2040, evaluated these impacts, using a number of metrics related to accessibility, mobility, and air quality. The analysis found that the LRTP would not cause disparate impacts or disproportionate burdens. The MPO’s TIP equity analysis methodology needs to be refined before it can be used to determine potential benefits and burdens.
The importance of incorporating transportation equity into the MPO’s planning and programming activities is reflected in the MPO’s certification documents: the LRTP, TIP, and UPWP. The MPO’s commitment to equity is also demonstrated through its performance-based planning practice (PBPP) and ongoing public participation process.
The LRTP describes the MPO’s transportation policies and goals and lays out an investment program for the region’s transportation system for a 20-plus-year period. The six goals in Charting Progress to 2040, and their accompanying objectives, guide TIP, LRTP, and UPWP project and study selection. One of the goals—transportation equity—has three objectives that are designed to improve access to and benefit from the transportation-planning process: 1) target investments to benefit a high percentage of low-income and minority populations, 2) minimize burdens in low-income and minority areas, and 3) break down barriers to participating in MPO decision-making.
Every year, the MPO develops a TIP that prioritizes transportation investments over a five-year period. Project selection is guided by the MPO’s vision, goals, and objectives as stated in the LRTP. To meet the transportation equity goal, the MPO has developed project-selection criteria to assess whether a project serves one or more protected populations, as well as whether it creates a disparate impact or disproportionate burden.
The UPWP describes how the region’s federal transportation-planning funds will be spent each year. Every year, the MPO makes an effort to select UPWP studies that directly or indirectly address the needs of protected populations.
The Boston Region MPO is working to develop and implement its PBPP, through which the MPO can monitor and evaluate its progress toward achieving the goals established in the LRTP. Because transportation equity is a critical goal, it is being integrated into the MPO’s PBPP, through which staff is tracking transportation investments in minority and low-income communities to ensure that all areas of the region benefit from the programming for federal dollars.
The MPO’s Public Participation Plan (PPP) describes the various public outreach and communications activities in which the MPO engages to ensure that all members of the public have the opportunity to participate in the metropolitan transportation-planning process. The PPP specifically identifies ways in which the MPO promotes participation among populations that historically have been underserved by the transportation system and/or have lacked access to the decision-making process. The MPO incorporates inclusive public outreach into every aspect of its transportation-planning process.
Please note that the text of some pages in this report may not be accessible to individuals with low or no vision who use a screen reader. These include the FTA and FHWA certifications and assurances and the Title VI program MPO member endorsement page. If you would like to request these or any other material in this report in a different format, please contact the Central Transportation Planning Staff (CTPS) via email at publicinfo@ctps.org.
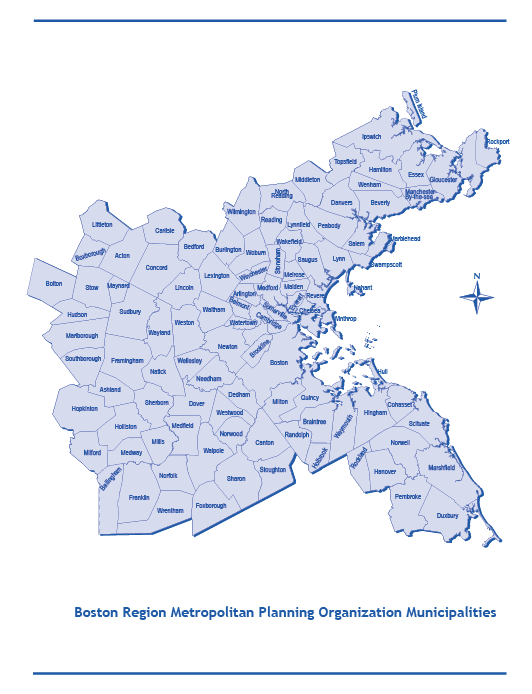
Covering 101 municipalities in eastern Massachusetts, the Boston Region MPO consists of a 22-member board of state agencies, regional transportation-planning organizations, and elected local officials who represent the region’s diverse transportation interests. MPO members, supported by staff, are responsible for allocating federal funds for public transit, roadway, bicycle, and pedestrian projects in the region. In collaboration with MPO staff, they are also responsible for setting the region’s transportation vision, goals, and objectives. These are reflected in the studies, reports, technical memoranda, and the three federally required certification documents that MPO staff produces: the Transportation Improvement Program (TIP), Long-Range Transportation Plan, (LRTP) and Unified Planning Work Program (UPWP).
The MPO’s vision, as updated for the 2040 LRTP, Charting Progress to 2040, is as follows: “The Boston Region Metropolitan Planning Organization envisions a modern transportation system that is safe, uses new technologies, provides equitable access, excellent mobility, and varied transportation options—in support of a sustainable, healthy, livable, and economically vibrant region.”
The MPO also established goals to help make its vision a reality; these goals (cited below) guide the various work that the MPO undertakes and help staff prioritize the studies and transportation projects that the MPO funds.
The MPO’s vision, goals, and objectives reflect the diverse transportation needs of the more than 3.1 million people who live in the region. Encompassing 1,405 square miles, it contains urban centers, established and emerging suburbs, coastal towns, and rural communities. In addition to this geographic diversity, the region’s residents represent a rich ethnic, racial, and cultural diversity. More than one-quarter of residents are non-White and/or of Hispanic origin and more than 38 non-English languages are spoken in homes throughout the region. More than 10 percent of the region’s population lives in poverty,2 and 16 percent of households do not have access to a car, meaning that affordable, non-auto transportation modes are vital to many residents in the region.
The MPO strives to take into account this demographic, cultural, environmental, and economic diversity when funding transportation projects and evaluating their impacts. To this end, this Title VI Triennial Report reflects the MPO’s efforts during the past three years3 to identify the specific transportation concerns and needs of populations protected under Title VI of the Civil Rights Act of 1964 and the related limited English proficiency EO 13166. The report also discusses actions taken by the MPO to address the needs of the populations protected by Executive Order 12898 (EJ EO) concerning environmental justice (EJ) and the Americans with Disabilities Act of 1990 (ADA). The MPO believes that these efforts are vital: they comply with federal regulations, and also reflect sound transportation-planning practices, reflecting the MPO’s vision of providing equitable transportation access and involvement in the MPO decision-making process to all residents in the region regardless of their background.
The MPO’s Title VI and Transportation Equity (TE) programs were developed in response to federal laws, namely the Civil Rights Act of 1964, and several EOs. These two programs seek to ensure that people who historically have been excluded from participating in the MPO transportation-planning process, and who have been underserved by transportation investments, have opportunities to participate, have a voice in the selection of transportation investments in their communities, and receive a fair share of their region’s investments. Through these programs, the Boston Region MPO remains committed to a transparent, accessible, and open transportation-planning process as it considers all residents’ needs in developing its plans and selecting the studies and projects it funds.
The following subsections discuss the federal statutes and EOs that govern the MPO’s civil rights activities, the regulations and guidance that direct their implementation, and the populations covered by each.
Title VI is part of the Civil Rights Act of 1964. It states that “no persons in the United States shall, on the grounds of race, color, or national origin, be excluded from participation in, be denied the benefits of, or be subjected to discrimination under any program or activity receiving federal financial assistance.” As recipients of federal financial assistance from FHWA and the FTA, all MPOs are required to document their efforts to ensure that their activities, programs, and services are not discriminatory on these grounds.
The following races and ethnicities are protected under Title VI: American Indian/Alaska Native; Asian; Black/African American; Hispanic or Latino, of any race; and Native Hawaiian/other Pacific Islander. Discrimination on the basis of limited English language proficiency (LEP) qualifies as discrimination on the basis of national origin as provided under Title VI. While prohibition of discrimination based on national origin dates back to the Civil Rights Act, EO 13166, “Improving Access to Services for Persons with Limited English Proficiency,” and several subsequent iterations of clarifying guidance led to LEP being recognized as the primary way of identifying national origin.
EO 13166 directs federal agencies to take reasonable steps to provide meaningful language access in their services, and for all recipients of any federal financial assistance to do the same, regardless of whether those services are directly supported financially by a federal agency. In 2002, the Department of Justice (DOJ) finalized guidance on how recipients can provide meaningful LEP access. In 2005, the U.S. Department of Transportation (USDOT) issued its own LEP guidance, which was based on the DOJ guidance. Under this guidance, FTA and FHWA recipients and subrecipients are required to develop a Language Assistance Plan (LAP), in which they establish procedures for identifying the number of LEP persons who may be served; determining how language assistance will be provided; establishing a process for training staff; notifying LEP persons about available resources; and monitoring and updating the LAP. As part of the LAP, recipients complete a “Four Factor Analysis” to determine what constitutes meaningful access for LEP persons and identify those languages that are most widely spoken amongst the population that is served. The guidance also identifies which documents are considered “vital,” and thus should be translated.
In their role in carrying out the mission and directives of Title VI, the FTA and FHWA have each issued their own guidance for recipients of their financial assistance regarding compliance with Title VI. The latest FTA guidance, FTA Circular 4702.1B, was issued in 2012. It describes the contents of FTA’s Title VI compliance programs that must be adopted and maintained by their recipients. FHWA incorporates Title VI into a broader application of non-discrimination statutes, regulations, and EOs into its Title VI/non-discrimination program. FHWA’s Title VI/non-discrimination program also covers discrimination based on sex, disability status, income, and age, through the FHWA Title VI program requirements, Age Discrimination Act of 1975, Rehabilitation Act of 1975, and Title 23 (section 324) of the U.S. Code prohibiting discrimination based on sex. Guidance for financial recipients is found in the 2015 “Federal Highway Administration Environmental Justice Reference Guide.”
Environmental justice at the federal level is based on EO 12898, “Federal Actions to Address Environmental Justice in Minority Populations and Low-income Populations.” Signed by President Clinton in 1994, this EJ EO instructs federal agencies to identify and address any disproportionately high and adverse human health and environmental effects of their programs, policies, and activities on minority and low-income populations. To this end, each agency must develop strategies to incorporate EJ principles into their operations and into those of the recipients of their financial assistance. The EJ EO does not create new legal mandates; rather, it ensures that EJ is considered when implementing existing statutes. Although the EJ EO applies to federal agencies, the requirements are passed through to their recipients of federal financial assistance, such as MPOs, which implement federal policy and programs.
To assist their recipients, in 2012 the FTA published FTA C 4703.1, “Environmental Justice Policy Guidance for Federal Transit Administration Recipients.” The FTA has also incorporated some requirements for accommodating low-income populations into its Title VI Circular—specifically with regard to fare and service equity analyses for transit providers. FHWA EJ guidance may be found the EJ reference guide referenced above.
The ADA prohibits public entities from discriminating against people with disabilities or excluding them from participating in, or denying them the benefits of, the entities’ services, programs, or activities. Although disability protections are not explicitly a part of Title VI, they are implied in the inclusive public participation requirements. For MPOs, this means that public meetings are held in accessible buildings and that vital MPO documents are available in accessible formats to members of the public.
The Boston Region MPO follows a “3C” transportation-planning process—continuing, comprehensive, and cooperative—that results in plans, documents, and programs that are consistent with the transportation objectives of the MPO. To be continuing, MPO work is conducted on an ongoing basis; to be comprehensive, the work is inclusive of all transportation modes, all populations, all areas in the region, and all of the regional transportation needs; and to be cooperative, the work is performed in close communication and consultation with all of the region’s municipalities and with a broad coalition of agencies, organizations, and stakeholders.
As part of the 3C process, the MPO produces the TIP, LRTP, and UPWP, which are required for the MPO to be certified as meeting federal requirements for metropolitan transportation planning and to receive federal surface transportation funds. All three documents, to different degrees, prioritize projects that address the needs of populations included in the MPO’s TE and Title VI programs. The MPO’s TE and Title VI programs support the various 3C-document equity analyses, public outreach efforts, and MPO-led equity-related studies. The Title VI program focuses on FTA and FHWA requirements that help ensure that minority and LEP persons are not subject to discrimination in the course of the MPO’s work, and that Title VI reports are developed as necessary. The TE program is broader-based, tasked with identifying and addressing the concerns of a wider range of EJ and other protected populations that have been traditionally under-represented in the transportation-planning process and underserved by the transportation system. This program includes collecting and analyzing data, conducting public outreach, and evaluating whether the transportation needs of protected populations are being met.
As a subrecipient of federal funding from the FTA and FHWA, the MPO is required to incorporate Title VI regulations into all of its planning and programming activities. The subsections that follow provide an overview of how the MPO incorporates Title VI and EJ into the planning processes for each of the certification documents. You may find more detailed information in Chapter Four.
The MPO’s TIP, which is produced every year, allocates funding to projects within the MPO region over a five-year period.4 Projects that are selected for the TIP—which include public transit, roadway, bicycle, and pedestrian transportation projects—reflect the MPO’s vision, goals, and objectives, as identified in the MPO’s LRTP.
Because there is not enough funding available to support every project that is proposed for inclusion in any given TIP, MPO staff evaluate each project based on a set of pre-determined criteria to select those that most align with the MPO’s vision, goals, and objectives. There are 28 criteria that relate directly to the MPO’s six goals, one of which concerns transportation equity. A project can earn up to 12 points for serving Title VI/EJ/non-discrimination populations. Ensuring that all residents share in the benefits of the MPO’s TIP investments is an important part of the MPO’s planning work.
The purpose of the LRTP is twofold: 1) to develop a long-range vision that identifies which transportation issues are of greatest concern to the MPO and the public, and 2) to recommend projects over the 20-year-plus time horizon of the LRTP that reflect this vision. The vision and related goals and objectives guide not only the long-range planning process, but all of the MPO’s planning work as well, including the TIP, UPWP, its public participation program, and its TE and Title VI programs. Projects or investment programs must be contained in the LRTP to be programmed in the TIP.
The UPWP identifies the studies, programs, and resources that the MPO will fund in the course of a year. It includes certification requirements, transportation studies that MPO staff conduct, and ongoing work programs, such the MPO’s Title VI and TE programs. Proposed studies are evaluated based on several criteria, including how a program helps to accomplish the MPO’s LRTP goals; what transportation modes it addresses; the scale of the study; the time frame and type of impact anticipated; whether it furthers existing work; and if it is a new idea or has been funded in the past. The UPWP always includes programs and projects that relate directly or indirectly to understanding and/or furthering the needs of protected populations.
This document covers the MPO’s work related to its Title VI program in federal fiscal years (FFYs) 2015, 2016, and 2017, and is based on the structure of the FTA’s Title VI circular. To demonstrate compliance with FHWA’s Title VI/non-discrimination requirements, the document also reports on parallel efforts to engage and accommodate a broader set of protected populations through the MPO’s TE program. Chapter Two of this report demonstrates how the Boston Region MPO has satisfied the FTA Title VI Circular’s general reporting requirements, which are also required by FHWA. Chapter Three provides evidence that the MPO has satisfied MPO-specific requirements. Finally, Chapter Four discusses how the MPO integrates Title VI and EJ requirements and principles into its transportation-planning activities.
The MPO’s FTA and FHWA Title VI assurances for FFY 2017 may be found at the beginning of this document.
Title 49 Code of Federal Regulations (CFR) Section 21.9(d) requires recipients to provide information to the public regarding the recipient’s obligations under USDOT Title VI regulations and to apprise members of the public of the protections against discrimination afforded to them by Title VI. The MPO notice, updated in 2015 and adapted from a MassDOT prototype, is reproduced in Appendix C. It includes translations of the following statement into seven languages (including simplified and traditional Chinese) in accordance with MassDOT’s request: “If this information is needed in another language, please contact the Boston Region MPO’s Title VI Specialist at 857-702-3700.” These are displayed on the MPO’s website and in multiple locations within MPO offices where members of the public likely would see them. The MPO website also contains translations of the full state and federal notices into seven languages. Links to the web version are also accessible through the MPO’s standard email communications regarding vital documents and communications, which include, but are not limited to, notifications about public comment periods for certification documents and MPO-sponsored meetings. Should analysis by MPO staff show the need to include other languages, this notice will be updated accordingly.
The MPO’s endorsement is located at the front of the document. Please note that the text of the endorsement is not accessible to individuals with low or no vision who use a screen reader.
In order to comply with both FTA and FHWA requirements, the MPO has developed procedures for receiving, investigating, addressing, and tracking Title VI complaints (these are posted on the MPO website and may be found in Appendix B).
The Boston Region MPO has not received any Title VI complaints or been involved in any Title VI investigations or lawsuits since the 2014 triennial report.
The MPO’s policy is that LEP persons be neither discriminated against nor denied meaningful access to and participation in the programs, activities, and services provided by the MPO. To that end, MPO staff has developed a LAP to ensure that the MPO employs appropriate strategies for assessing the need for language services and implementing them in order to provide meaningful access to the MPO’s transportation-planning process and published information, without placing undue burdens on the MPO’s resources. The LAP (which may be found in Appendix D of this report) has been revised since the MPO’s last Title VI triennial report. Also, in September 2014, the MPO published internally its CTPS5 Non-discrimination Handbook for the benefit of staff. This guide describes MPO protocol for document and web accessibility, accessibility requisites for all MPO and MPO-sponsored meetings, and information about civil rights requirements and communications with protected populations. Future LAP updates will reflect these and other changes, as appropriate.
The MPO does not have any planning or advisory bodies for which the MPO selects the membership. The Regional Transportation Advisory Council (Advisory Council) is the only MPO advisory body that is not made up of MPO members or other elected officials. It is an independent group charged with providing a forum for education about metropolitan transportation-planning issues—including, but not limited to, transit—and a space for the public to offer input on the MPO’s activities. The Advisory Council chair is also a voting member of the MPO board, and thus participation in the Advisory Council enables non-profits, government bodies, and members of the public to provide feedback to the MPO board on proposed plans, projects, and programs. Individuals are welcome to participate in all Advisory Council meetings, but membership is limited to public and private organizations and governmental units. Although entities volunteer for membership, it is made official by a vote of the existing members.
Staff is engaged in an ongoing effort to recruit entities that represent the interests of protected populations to participate in the Advisory Council. Organizations representing EJ populations are encouraged to participate in the Advisory Council via public outreach activities. During public participation events, staff recommends that these organizations attend Advisory Council meetings and consider applying for Advisory Council membership if doing so fits with their mission and goals.
In 2017, one organization—the MBTA Rider Oversight Committee— joined the Advisory Council based on MPO staff’s suggestion that their attendance and participation could be useful. Because the Advisory Council member organizations are not selected by the MPO, a table depicting the racial breakdown of the membership is not included in this report.
The MPO is committed to ensuring that its public documents and meetings are accessible to people with physical and/or cognitive disabilities, as well as to people with limited English proficiency. To that end, the MPO has allotted financial resources and staff time, as resources allow, accommodating these populations. Between April 1, 2016 and March, 31, 2017, the MPO spent $91,536 to provide materials in accessible formats (staff time costs), and $3,354 on LEP services (staff time costs and as well as direct expenses associated with translation and interpretation services).
The MPO currently does not have statistics identifying the usage of translated and accessible documents on the MPO website. However, in 2017 staff initiated a comprehensive effort to collect this data via Google Analytics (see subsection 3.6 for more details on this effort).
No requests for interpretation services or for additional translations of MPO documents have been submitted in the last three years.
More details regarding the MPO’s efforts to provide language services to LEP persons may be found in the Boston Region MPO’s LAP (included in Appendix D) and in subsection 3.6. Details regarding the MPO’s disability accommodations may be found in subsection 3.6.
Metropolitan planning organizations are required to develop demographic profiles for the purpose of identifying minority populations under the FTA’s Title VI Circular 4703.1B. The MPO also prepares demographic profiles for other Title VI EJ, LEP, and low-income populations. The data gathered during these efforts, as well as the profiles themselves—which consist of detailed maps and tables—contribute to the MPO’s planning and analysis efforts in the course of developing 3C documents and programs, conducting UPWP studies, and undertaking public outreach.
The MPO has also identified other transportation equity populations—elderly, people with disabilities, zero-vehicle households, and female-headed households with children—based on other federal regulations. They are part of the MPO’s TE program to improve outreach to populations who may be particularly affected by changes in the region’s transportation system and who may face significant barriers to participating in the MPO’s planning process.
MPO staff updates demographic profiles as new data become available. For this report, data from the 2010 Decennial Census and the 2010–2014 American Community Survey (ACS) were used. Because the MPO uses the transportation analysis zone (TAZ) as the unit of analysis, population and household totals are adjusted to the 2010 Decennial Census totals; therefore, region-wide totals vary slightly between populations.6
Demographic profiles identify those TAZs within the MPO’s region that exceed the regional threshold set for each of the seven transportation equity populations identified above. For most, the regional threshold is defined as the average of the population within the MPO region. The exception is the low-income population, whose threshold is 60 percent of the region’s median household income. Data from the 2010–2014 ACS show that the region-wide median income is $76,040 and that the low-income threshold is $45,624. This threshold is used in most efforts related to the MPO’s Title VI reporting and in the MPO’s TE program, as well as equity analyses conducted for the LRTP. The MPO selected the 60 percent threshold because it more accurately reflects the high cost of living in the region than does the federal poverty guidelines that the FTA and FHWA recommend as an alternative for the low-income threshold. (The MPO’s proposed TIP equity analysis uses 200 percent of the poverty level as the low-income threshold; see subsection 3.3 for a discussion of the analysis. Staff currently is evaluating the use this threshold in the other aspects of the MPO’s TE program.) Low-income populations are defined as readily identifiable groups of low-income persons who live in geographic proximity, or, if warranted, geographically dispersed or transient populations.
The MPO uses the FTA’s and FHWA’s definition of minority persons: people who are American Indian/Alaska Native; Asian; Black/African American; Hispanic/Latino, regardless of race; and/or Native Hawaiian or other Pacific Islander. Minority populations are defined as readily identifiable groups of minority persons who live in geographic proximity, or, if warranted, geographically dispersed or transient populations. Persons with limited English proficiency are defined by federal regulations as persons for whom English is not their primary language and who have a limited ability to read, write, or understand English. For the purposes of Title VI reporting, FTA defines LEP persons as those aged five and older who report to the U.S. Census Bureau that they speak English less than “very well.”7 (Non-LEP individuals are those who report speaking English “very well.”) This definition is used by the MPO.
For the purposes of Title VI, individuals are classified as “minority” on the basis of both race and ethnicity. Table 1 shows the racial characteristics of the Boston Region MPO area, based on self-identification as one of the racial categories on the Census form. Table 2 shows the ethnic characteristics of the population—regardless of race—based on self-identification as being of Hispanic or Latino descent. Table 3 shows the total minority population for both race and ethnicity. Data for all three tables are derived from the 2010 Decennial Census, according to which 878,164 people belong to a minority race or ethnicity in the MPO region, or 27.8 percent of the total population. The largest racial minority group is Black/African American, making up 8.6 percent of the region’s population. Hispanics/Latinos, of any race, make up 9.1 percent of the region’s population.
Table 1
Racial Characteristics of the Boston Region MPO
| Racial Minority* |
Population |
Percent of Population |
|---|---|---|
| Black/African American |
272,320 |
8.6% |
| American Indian/Alaska Native |
7,625 |
0.2% |
| Asian |
239,640 |
7.6% |
| Native Hawaiian/other Pacific Islander |
1,052 |
0.03% |
| Another race |
142,703 |
4.5% |
| Two or more races |
84,889 |
2.7% |
| White |
2,413,532 |
76.3% |
| Total Racial Minority Population |
748,229 |
23.7% |
| Total Population |
3,161,761 |
100% |
*Includes those who identify their ethnicity as either Hispanic/Latino or non-Hispanic/Latino.
MPO = Metropolitan planning organization.
Source: Source: Decennial US Census, 2010.
Table 2
Hispanic Characteristics of the Boston Region MPO
| Ethnicity* |
Population |
Percent of |
|---|---|---|
Hispanic (White) |
129,935 |
4.1% |
Hispanic (non-White) |
159,125 |
5.0% |
Non-Hispanic (any race) |
2,872,701 |
90.9% |
Total Hispanic Population |
289,060 |
9.1% |
Total Population |
3,161,761 |
100% |
*Includes those who identify as any race, including White.
MPO = Metropolitan planning organization.
Source: Source: Decennial US Census, 2010.
Table 3
Minority Characteristics of the Boston Region MPO
| Minority |
Population |
Percent of |
|---|---|---|
Racial minority (Hispanic or non-Hispanic) |
748,229 |
23.7% |
Hispanic (White) |
129,935 |
4.1% |
Total Minority Population |
878,164 |
27.8% |
Total Population |
3,161,761 |
100.0% |
MPO = Metropolitan planning organization.
Source: Source: Decennial US Census, 2010.
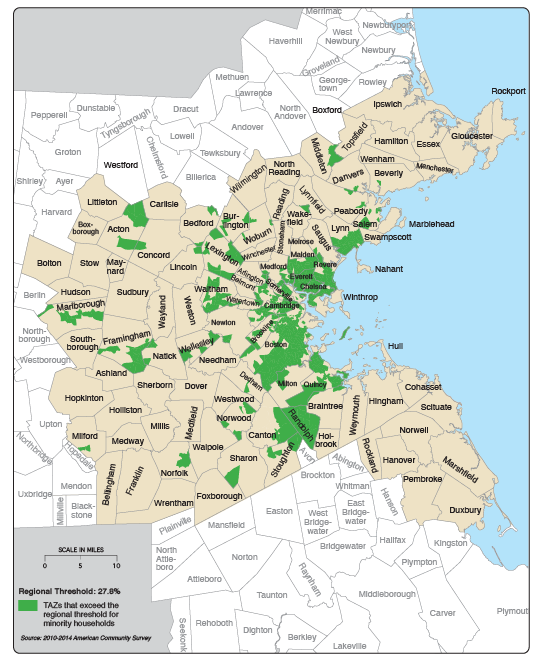
One-third of the MPO’s 1,943 TAZs (653) exceed the regional minority threshold of 27.8 percent (Table 4). Figure 1 illustrates those TAZs that exceed the regional threshold for minority population.
Table 4
Minority Population and Transportation Analysis Zones
|
|
Minority Population* |
|
|
|
Minority TAZs |
|
||
Total Population |
|
Count |
Regional Threshold |
|
Total TAZs |
|
Count |
Percent |
|
3,161,761 |
|
878,164 |
27.8% |
|
1,943 |
|
653 |
33.6% |
|
*Includes all who identify as any race other than White (regardless of ethnicity), as well as those who identify their race as White and their ethnicity as Hispanic/Latino.
TAZ = Transportation analysis zone.
Source: Decennial US Census, 2010.
Figure 1
Minority Transportation Analysis Zones
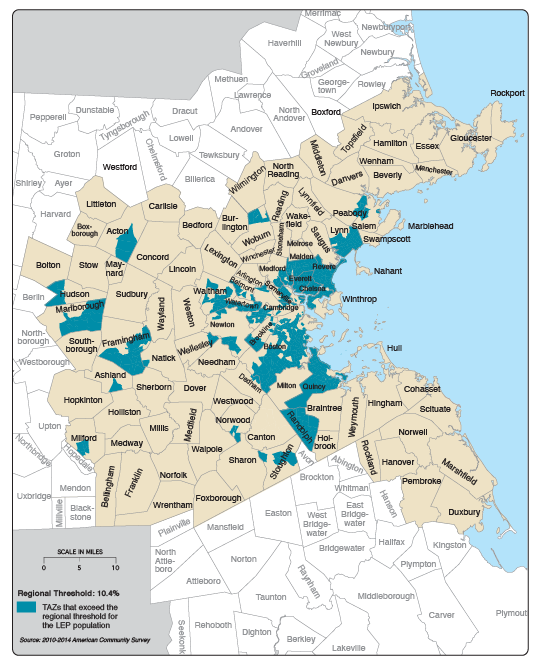
Data from the 2010–2014 ACS show that 10.4 percent of the MPO population who are five years and older have limited English proficiency. Table 5 shows the number and percent of the general population and the LEP population that are LEP, as well as those TAZs that exceed the regional threshold of 10.4 percent.
Table 5
LEP Population and Transportation Analysis Zones
|
|
LEP Population* |
|
|
|
LEP TAZs |
|
||
Population ≥ 5 Years |
|
Count |
Regional Threshold |
|
Total TAZs |
|
Count |
Percentage |
|
2,985,274 |
|
311,134 |
10.4% |
|
1,943 |
|
606 |
31.2% |
|
*Persons who speak English less than "very well" according to the American Community Survey.
LEP = Limited English proficiency. TAZ = Transportation analysis zone.
Source: American Community Survey, 2010–2014.
Figure 2 shows where LEP TAZs are located within the MPO region. Maps that show the distribution of where safe harbor languages are spoken may be found in Appendix D, the Boston Region MPO’s 2017 Language Assistance Plan.
Figure 2
Limited-English Proficiency Transportation Analysis Zones
The MPO identified the region’s safe harbor languages as part of the LAP—non-English languages that are spoken “well,” “not well,” or “not at all” by at least 1,000 people or at least 5 percent of the population (whichever is less). These languages are listed in Table 6. Note that the number of LEP persons who speak safe harbor languages (286,379) is less than the total number of LEP persons in the region (310,999). This is because safe harbor languages do not include every non-English language that is spoken, only those that meet one or both of the thresholds. Spanish is the most commonly spoken non-English language, with approximately 105,380 speakers, which is 33.9 percent of all LEP persons and 3.5 percent of the entire population aged five and older. It is followed by Chinese, Portuguese, French Creole, and Vietnamese. Speakers of safe harbor languages make up 9.6 percent of the region’s population age five and older.8
Although the MPO identifies all of the safe harbor languages within the region, vital documents are not translated into all of these languages. The MPO does not come into contact with LEP persons on a frequent or regular basis; thus, translating vital documents into all 19 safe harbor languages would be unnecessarily cost-prohibitive. Additionally, while transportation improvements resulting from the MPO’s planning and programming decisions have an impact on all residents’ mobility and quality of life, denial or delay of access to the MPO’s activities would not have immediate or life-threatening implications for LEP persons.
The MPO will continue to evaluate language needs and balance these with available resources by collecting website translation usage, reaching out to LEP persons and organizations that represent them, and analyzing language datasets such as the ACS.
Table 6
Safe Harbor Languages Spoken in the Boston Region MPO
| Language |
LEP |
Pct. of LEP Populationb |
Pct. of MPO Population |
|---|---|---|---|
Spanish |
105,380 |
33.9% |
3.5% |
Chinese |
49,909 |
16.0% |
1.7% |
Portuguese |
34,795 |
11.2% |
1.2% |
French Creole |
21,566 |
6.9% |
0.7% |
Vietnamese |
15,086 |
4.9% |
0.5% |
Russian |
11,761 |
3.8% |
0.4% |
Arabic |
9,747 |
3.1% |
0.3% |
Italian |
7,792 |
2.5% |
0.3% |
French |
5,796 |
1.9% |
0.2% |
Korean |
5,330 |
1.7% |
0.2% |
Greek |
3,701 |
1.2% |
0.1% |
Mon-Khmer, Cambodian |
3,145 |
1.0% |
0.1% |
Japanese |
2,749 |
0.9% |
0.1% |
Hindi |
2,063 |
0.7% |
0.1% |
Polish |
1,747 |
0.6% |
0.1% |
Armenian |
1,627 |
0.5% |
0.1% |
Gujarati |
1,562 |
0.5% |
0.1% |
Tagalog |
1,376 |
0.4% |
0.0% |
Persian |
1,247 |
0.4% |
0.0% |
Total LEP Safe Harbor Language Speakers |
286,379 |
92.1%c |
9.6% |
Total LEP Population |
310,999 |
100.0% |
10.4% |
Total LEP Population ≥ 5 Years |
2,985,333 |
N/A |
100.0% |
aPersons who speak English less than "well,” not well,” or “not at all” according to the ACS. Non-LEP individuals are those who report speaking English “very well.” bThe total LEP population used in this column is 310,999. Note that it differs from the estimate given in Table 5 (311,134). See Footnote 4 for an explanation. c7.9% of LEP persons does not speak a safe harbor language.
LEP = Limited English proficiency. MPO = Metropolitan planning organization. N/A = Not available or applicable.
Source: American Community Survey, 2010–2014.
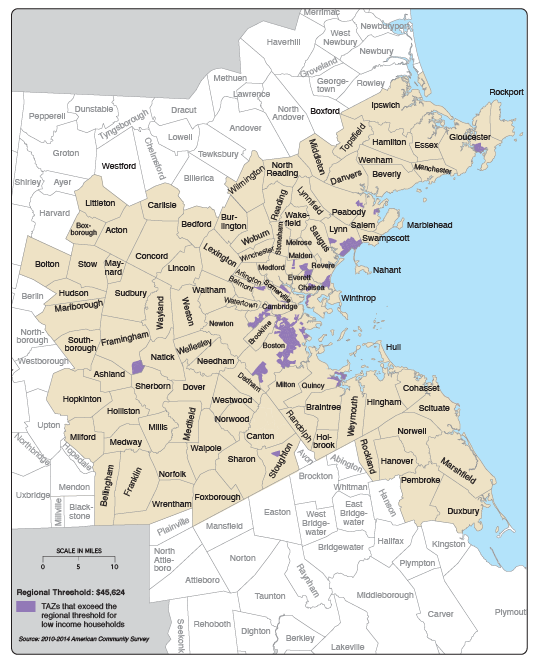
Table 7 shows the number of low-income households in the region and the number of TAZs with a median household income that falls below the regional threshold of $45,624. Of the 1,943 TAZs in the MPO region, 10.0 percent are low-income TAZs, while 32.2 percent of households are in low-income TAZs. Figure 3 shows the location of low-income TAZs in the MPO region.
Table 7
Low-income Households and Transportation Analysis Zones
|
|
|
|
Low-income HHs |
|
|
|
Low-income TAZs |
|
||
Median HH Income |
Regional Threshold |
Total HHs |
|
Count |
Pct. |
|
Total TAZs |
|
Count |
Pct. |
|
$76,040 |
$45,624 |
1,243,195 |
|
399,815 |
32.2 |
% |
1,943 |
|
194 |
10.0 |
% |
HH = Household. TAZ = Transportation analysis zone.
Source: American Community Survey, 2010–2014.
Figure 3
Low-Income Transportation Analysis Zones
In addition to the populations protected under Title VI and the EJ EO, FHWA includes populations defined on the basis of sex, age, and disability under its Title VI/non-discrimination program. The MPO consequently includes other populations in its TE program with the goal of improving their access to the MPO’s transportation-planning process and considering their needs in the decision-making process.
To select additional populations, the MPO identified indicators of potential disadvantage. These are based on demographic characteristics that are associated with populations that rely heavily on public transportation, have limited resources to adapt to significant changes in the transportation system, and are under-represented in the metropolitan transportation-planning process. In addition to minority, low-income, and LEP status, the indicators of potential disadvantage that the MPO selected include the concentrations of people with disabilities, the elderly (75 years of age and older), female-headed households with children (FHWC), and zero-vehicle households. MPO staff makes concerted efforts to understand the transportation needs of these populations through a combination of data analysis and public outreach.
In demographic profiles, the MPO identifies TAZs in which the population of each indicator of potential disadvantage equals or exceeds the percent in the entire MPO region. The maps that show the distribution of these TAZs for elderly, female-headed households with children, people with disabilities, and zero-vehicle households are contained in Appendix E of this report. Table 8, below, shows the distribution of TAZs that exceed the regional thresholds for each of the four other indicators of potential disadvantage.
Table 8
Other Transportation Equity Populations
| TE Population |
MPO Population or HHs |
TE Population or HHs |
TE Pct. of MPO Population or HHs |
Total |
TE |
Pct. TE TAZs |
|---|---|---|---|---|---|---|
Elderly population |
3,161,844 |
211,355 |
6.7% |
1,943 |
744 |
38.3% |
Female-headed households |
1,243,176 |
143,781 |
11.6% |
1,943 |
622 |
32.0% |
People with disabilities |
3,161,436 |
317,559 |
10.0% |
1,943 |
816 |
42.0% |
Zero-vehicle households |
1,243,223 |
197,898 |
15.9% |
1,943 |
659 |
33.9% |
MPO = Metropolitan planning organization. HH = Household. TE = Transportation Equity. TAZ = Transportation analysis zone.
Sources: American Community Survey, 2010–2014; Decennial US Census, 2010.
The MPO considers elderly persons those who are 75 years of age or older. As of the 2010 Decennial Census, 6.7 percent of the MPO’s population (211,355 people) is elderly (Figure E-1, Appendix E), and 38.3 percent, or 744 TAZs, equals or exceeds the threshold based on the regional average of 6.7 percent.
Female-headed households with children are family households maintained by a female in which no spouse is present (Figure E-2, Appendix E). The region has 197,898 FHWC households, which is 11.6 percent of all households, and 32.0 percent, or 622 TAZs, equals or exceeds the threshold based on the regional average of 11.6 percent.
This profile includes people with a physical or cognitive disability, as self-reported in the 2010–2014 ACS. Ten percent of the population (or 317,559 people) has a disability (Figure E-3, Appendix E). Forty-two (42) percent of TAZs equal or exceed the threshold based on the regional average of 10.0 percent.
The final demographic indicator is households that do not have access to a personal vehicle (Figure E-4, Appendix E). Out of 1,243,223 households, 15.9 percent, or 197,898, do not have access to a vehicle, and thus rely on other means of transportation. Of the TAZs in the region, 33.9 percent, or 659 TAZs, equals or exceeds the threshold based on the regional average of 15.9 percent.
In response to comments during the Boston Region MPO’s latest certification review, the MPO has also identified populations of youth (younger than age 18) and those who live in group quarters.
The MPO region contains 655,290 people who are younger than 18 years, or 20.7 percent of the population (Figure E-6, Appendix E). Table 9 below shows the age distribution of the MPO region’s population.
Table 9
Age Distribution of Boston Region MPO
| Age Group |
Population |
Pct. of Population |
|---|---|---|
Younger than five years |
176,380 |
5.6% |
Five to nine years |
179,023 |
5.7% |
10 to 14 |
184,084 |
5.8% |
15 to 19 years |
212,981 |
6.7% |
Younger than 18 years |
655,290 |
20.7% |
20 to 24 |
248,446 |
7.9% |
25 to 29 |
248,700 |
7.9% |
30 to 34 |
215,618 |
6.8% |
35 to 39 |
208,006 |
6.6% |
40 to 44 |
223,929 |
7.1% |
45 to 49 |
240,779 |
7.6% |
50 to 54 |
229,927 |
7.3% |
55 to 59 |
200,307 |
6.3% |
60 to 64 |
170,433 |
5.4% |
65 to 69 |
121,557 |
3.8% |
70 to 74 |
90,319 |
2.9% |
75 and older |
211,355 |
6.7% |
65 and older |
423,231 |
13.4% |
Total |
3,161,844 |
100.0% |
Source: Decennial US Census, 2010.
The MPO has also identified people who live in group quarters within the MPO region (Figure E-7, Appendix E). These people do not live in housing units (house, apartment, mobile home, or rented rooms); rather, they live in institutional group quarters that include correctional facilities, nursing homes, and mental hospitals; or in non-institutional group quarters that include college dormitories, military barracks, group homes, missions, and shelters. Within the MPO region, 31,302 people live in institutional group quarters, and 93,107 people live in non-institutional group quarters. Of the latter, 78,812 people live in college dormitories, which represents 63.4 percent of the group quarters population.
For public participation purposes, the MPO has developed a method to identify communities that may be especially vulnerable to changes in the transportation system, and that might be excluded from participating in the MPO’s transportation planning process. These are called “communities of potential disadvantage.” Knowing about them helps the MPO to prioritize its outreach to and communication with these communities; and staff anticipates that it will use this identification method for public participation purposes in the upcoming fiscal year.
The MPO now defines communities of potential disadvantage as TAZs in which the percent of the population meets the MPO’s regional thresholds for either 1) minority or low-income, or 2) three other demographic indicators (such as LEP, elderly, FHWC, people with disabilities, or zero-vehicle households). There is no minimum population a TAZ must have for it to be considered a community of potential disadvantage. Figure E-5 in Appendix E shows the TAZs in the region that are communities of potential disadvantage. It indicates that 1,382,811 people live in communities of potential disadvantage, within 52 municipalities; 809 TAZs, or 41.6 percent, are communities of potential disadvantage.
This analysis is an important source of information for the MPO’s public participation efforts, as it helps to identify opportunities for public outreach with communities that are the most at risk of not being heard. It also provides information about how to address the language needs of communities. Identifying communities of potential disadvantage does not replace the MPO’s practice of recognizing individual populations within TAZs; rather, it contributes to the MPO’s public outreach as it allows staff to identify communities that are potentially at the greatest risk of not being involved in the MPO transportation-planning process.
The potential impacts of proposed projects—disparate impacts for minority populations and disproportionate burdens for low-income populations—have been considered in the MPO’s LRTP since 2006. In addition, the MPO recently undertook an effort to develop a methodology that will enable staff to do a similar analysis for the MPO’s TIP. The goal of both analyses is to determine whether projects within each plan/program would cause disparate impacts or disproportionate burdens to minority or low-income communities compared to non-minority and non-low-income communities. The MPO calls this type of analysis an equity analysis.
To complete an equity analysis, although not required to, MPO staff has developed a draft disparate impact/disproportionate burden policy that sets thresholds for determining whether a set of projects will cause a disparate impact or disproportionate burden for minority and low-income populations, respectively. The analysis comprises several steps. First, the MPO uses a travel demand model to evaluate the impacts of a collection of projects. Selected metrics are calculated for minority, non-minority, low-income, and non-low-income populations. This is done twice, once for the build scenario and once for the no-build scenario. Then, for each population, the differences between the results of the two scenarios are calculated. Finally, these results are compared: between minority and non-minority populations and between low-income and non-low-income populations. If the ratio of each equals or exceeds the threshold of 1.20, then there is a disparate impact or disproportionate burden, respectively.
The threshold of 1.20—which is widely used by other MPOs—is based on two insights. First, because the model will never produce perfect results, a 10 percent margin of error is included in the model as a matter of course. Second, staff has determined that as much as a 10 percent difference in receipt of benefits or burdens is reasonable. Therefore, the MPO’s policy states that a disparate impact exists for a metric if the result shows that minority populations are subject to 20 percent or more of a burden or receive 20 percent or less of a benefit relative to non-minority populations. A disproportionate burden exists if low-income populations are subject to 20 percent or more of a burden or receive 20 percent or less of a benefit relative to non-low-income populations. As a part of the TE program, staff will revisit this draft policy and anticipates that it will be finalized during FFY 2018.
In 2015, the MPO adopted a new LRTP, Charting Progress to 2040. Using the thresholds in the draft DI/DB policy, staff performed an equity analysis on two scenarios to determine whether the projects in the proposed plan would cause a disparate impact or disproportionate burden to minority and low-income populations, respectively. The MPO’s draft DI/DB policy states that if the ratio between the investments for low-income/minority and non-low-income/non-minority populations exceeds 1.20, then a disparate impact or disproportionate burden exists. (You may find the full analysis in Appendix F, along with an updated analysis resulting from a 2016 LRTP amendment.) The draft policy was developed in the context of the LRTP, and is not meant to be used for other analyses that need a DI/DB policy. Based on recent studies, staff has determined that different DI/DB policies should be developed for the TIP equity analysis (see subsection 3.3.2) and the analysis of TIP public transit investments (see subsection 3.4.2), and that all three DI/DB policies should set distinct thresholds for each metric that is being analyzed.
The two scenarios analyzed in the LRTP are:
The analysis looked at how the scenarios would impact mobility, accessibility, and auto emissions for low-income and minority communities, and compared these impacts to those on non-low-income and non-minority communities.
These three categories included the following metrics:
The results showed that the recommended projects in Charting Progress to 2040 would not cause disparate impacts or disproportionate burdens to minority or low-income populations for any of the metrics. The MPO will continue to examine and refine the methodology used for this analysis in future LRTPs in order to ensure that it accurately reflects best practices as well as the transportation challenges that low-income and minority communities within the region face.
In 2016 and 2017, MPO staff undertook a UPWP study, Systemwide Title VI/Environmental Justice Assessment of TIP Projects, to develop a methodology for determining whether programmed projects, in the aggregate, within a given TIP will cause disparate impacts for minority populations and disproportionate burdens for low-income populations. The goal of this was to develop a workable “proof-of-concept” that showed that the analysis could be completed.
The study was performed on roadway projects in the FFYs 2016–2020 TIP. Staff selected two metrics with which to analyze the impacts on drivers traveling on TIP project roads, traffic safety, and travel time. New analysis methods were developed that used the travel demand model as well as off-model approaches. Staff successfully developed a “proof-of-concept” methodology, showing that identifying disparate impacts and disproportionate burdens on minority and low-income populations is feasible. Because the methodology has not been finalized, the results are not presented here. The MPO expects to finalize the methodology in FFY 2018.
The methodology will continue to be refined, and DI/DB policy will be developed that determines whether the results of this analysis cause disparate impacts and disproportionate burdens. Based on the challenges they encountered during the study, MPO staff identified several potential modifications to the methodology that they will examine. These include analyzing people who live adjacent to TIP projects, exploring additional roadway user metrics, and including public transit projects in the analysis. Other methodological refinements related to the MPO’s travel demand model are also planned. It is anticipated that the final methodology will be used on future TIPs adopted by the MPO.
The Boston Region MPO has completed three analyses that examined the distribution of TIP funding. The first consists of a geography-based method that determined the percent of Title VI, EJ, and other protected populations that are served by TIP projects of all modes. The second is a funding distribution analysis that shows where TIP projects are located relative to the location of TAZs that exceed the minority and/or low-income thresholds. The third TIP analysis is a use-based method, which, based on the share of their use of public transit, analyzes the impacts of the distribution of state and federal funds for public transit purposes in the aggregate to low-income and minority passengers. Staff also completed an analysis that examined the geographical distribution of UPWP funds among municipalities in the MPO region. As per federal guidance, minority and low-income populations were analyzed separately in all three analyses.
MPO staff completed an analysis and map of projects in the FFYs 2017–2021 TIP. This report examined the distribution of all MPO target-funded projects that serve TAZs that exceed regional thresholds for TE populations, relative to their population within the MPO region. The map shows the location of transit projects in the TIP, overlaid upon TAZs that exceed the regional thresholds of low-income and/or minority populations.
MPO staff analyzed target-funded projects in the FFYs 2017–2021 TIP to assess whether they were distributed equitably among TAZs that exceed the regional thresholds of TE populations. These populations were: minority, low-income, LEP, elderly, people with disabilities, and zero-vehicle households. The regional threshold for each TE population was based on the average percent of that population in the MPO region, with the exception of the low-income group. For many years, the MPO has set the threshold for low-income at 60 percent of the MPO region’s median household income. The MPO included low-income populations and other transportation equity populations in order to understand how transportation investments impact EJ and other vulnerable populations.
Table 10 shows the percent of each TE population (persons or households) that is served by TIP projects, as well as the entire population that is served. A project was considered to serve a TE population if it was located within one-half mile of a TAZ in which a TE population exceeded its regional threshold. (The thresholds are the same has those identified in the demographic profiles in section 3.2.) The fourth column shows the percent of the TE population or households that were served. These exceeded the respective thresholds for all of the TE populations, indicating that projects within the TIP were equitably distributed among residents who belong to TE populations and those that do not, relative to their proportion of the total population.
Table 10
Transportation Equity Populations Served by MPO Investments in
FFYs 2017–2021 TIP
| TE Population |
TE Population/ HHs Served |
Total Population/ HHs Served |
Pct. TE Population/ HHs |
Regional Threshold |
|---|---|---|---|---|
Minority population |
138,618 |
323,265 |
42.9% |
27.8% |
Low-income households |
50,815 |
128,028 |
39.7% |
32.2%a |
LEP population |
53,531 |
304,904 |
17.6% |
10.4% |
Elderly populationb |
44,555 |
323,265 |
13.8% |
6.7% |
Population with disabilities |
32,631 |
320,135 |
10.2% |
10.0% |
Zero-vehicle households |
35,947 |
128,028 |
28.1% |
15.9% |
aThe income threshold is $45,624. bAge 75 years or older.
HH = Household. LEP = Limited English proficiency. TE = Transportation Equity.
Sources: American Community Survey, 2010–2014; Central Transportation Planning Staff; Decennial US Census, 2010.
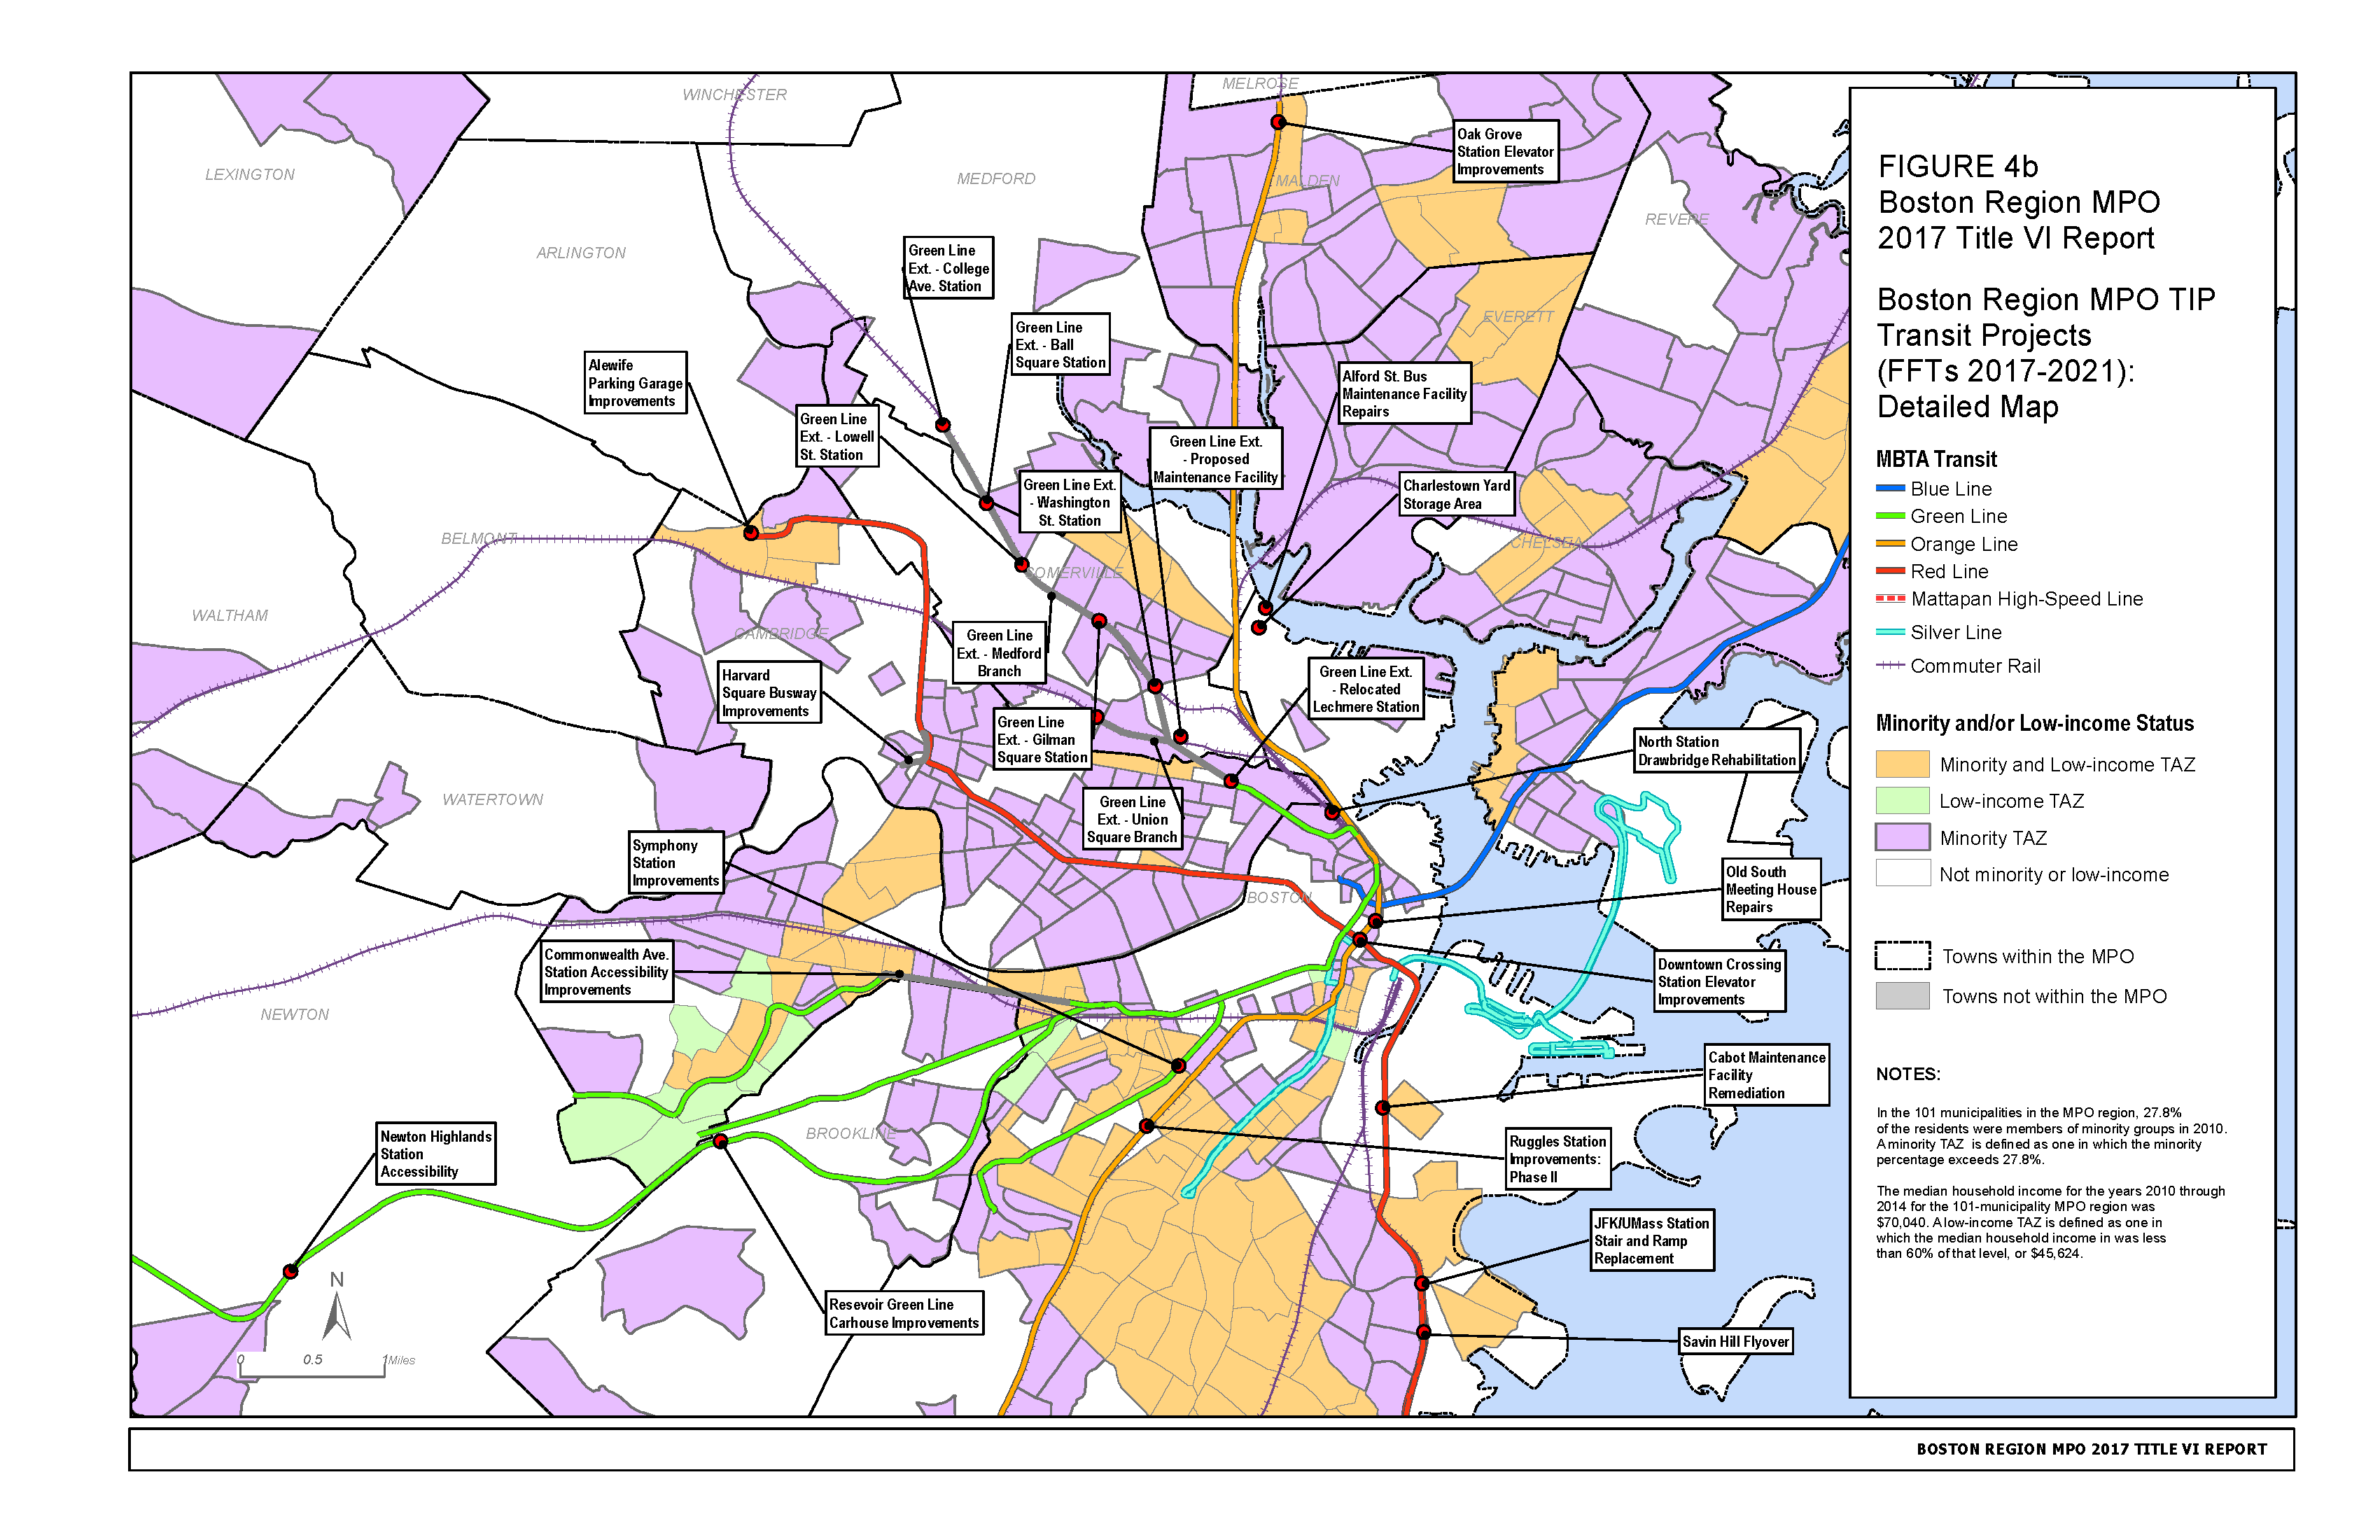
Figures 4a and 4b show the location of transit projects in the FFYs 2017–2021 TIP in the MPO region, as well as the location of TAZs that exceed the thresholds for low-income and/or minority populations. The projects included are only those with a physical location, such as improvements to stations, garages, and commuter rail or subway lines. Vehicle purchases, for example, are not included. The maps also do not indicate whether the investments are system-wide or which transit lines or passengers they benefit. To investigate the distribution of these benefits, staff undertook an analysis of all public transit investments whether or not they were mapped; these are described in subsection 3.4.2.
There are several data challenges that would facilitate a more accurate mapping of public transit-related TIP projects. For example, beyond the first year of the TIP, it is often unclear which projects will be undertaken under the various MBTA funding programs. Data are especially scarce for bus improvements, such as vehicle acquisition—that is, for which lines or garages will the new buses be used. Without this information, bus improvements cannot be mapped. Similarly, transit funding programs such as the elevator program, positive train control, and systems upgrades often cannot be mapped because the stations, facilities, or lines that will receive the improvements have not yet been identified. (These challenges are also applicable to the analysis of public transit-related TIP projects described in subsection 3.4.2. They are compounded by the fact that ridership data will necessarily be coarse as some of the funding programs have not yet been allocated to specific routes and lines.)
Figure 4a
Boston Region MPO TIP Transit Projects (FFYs 2017–2021)
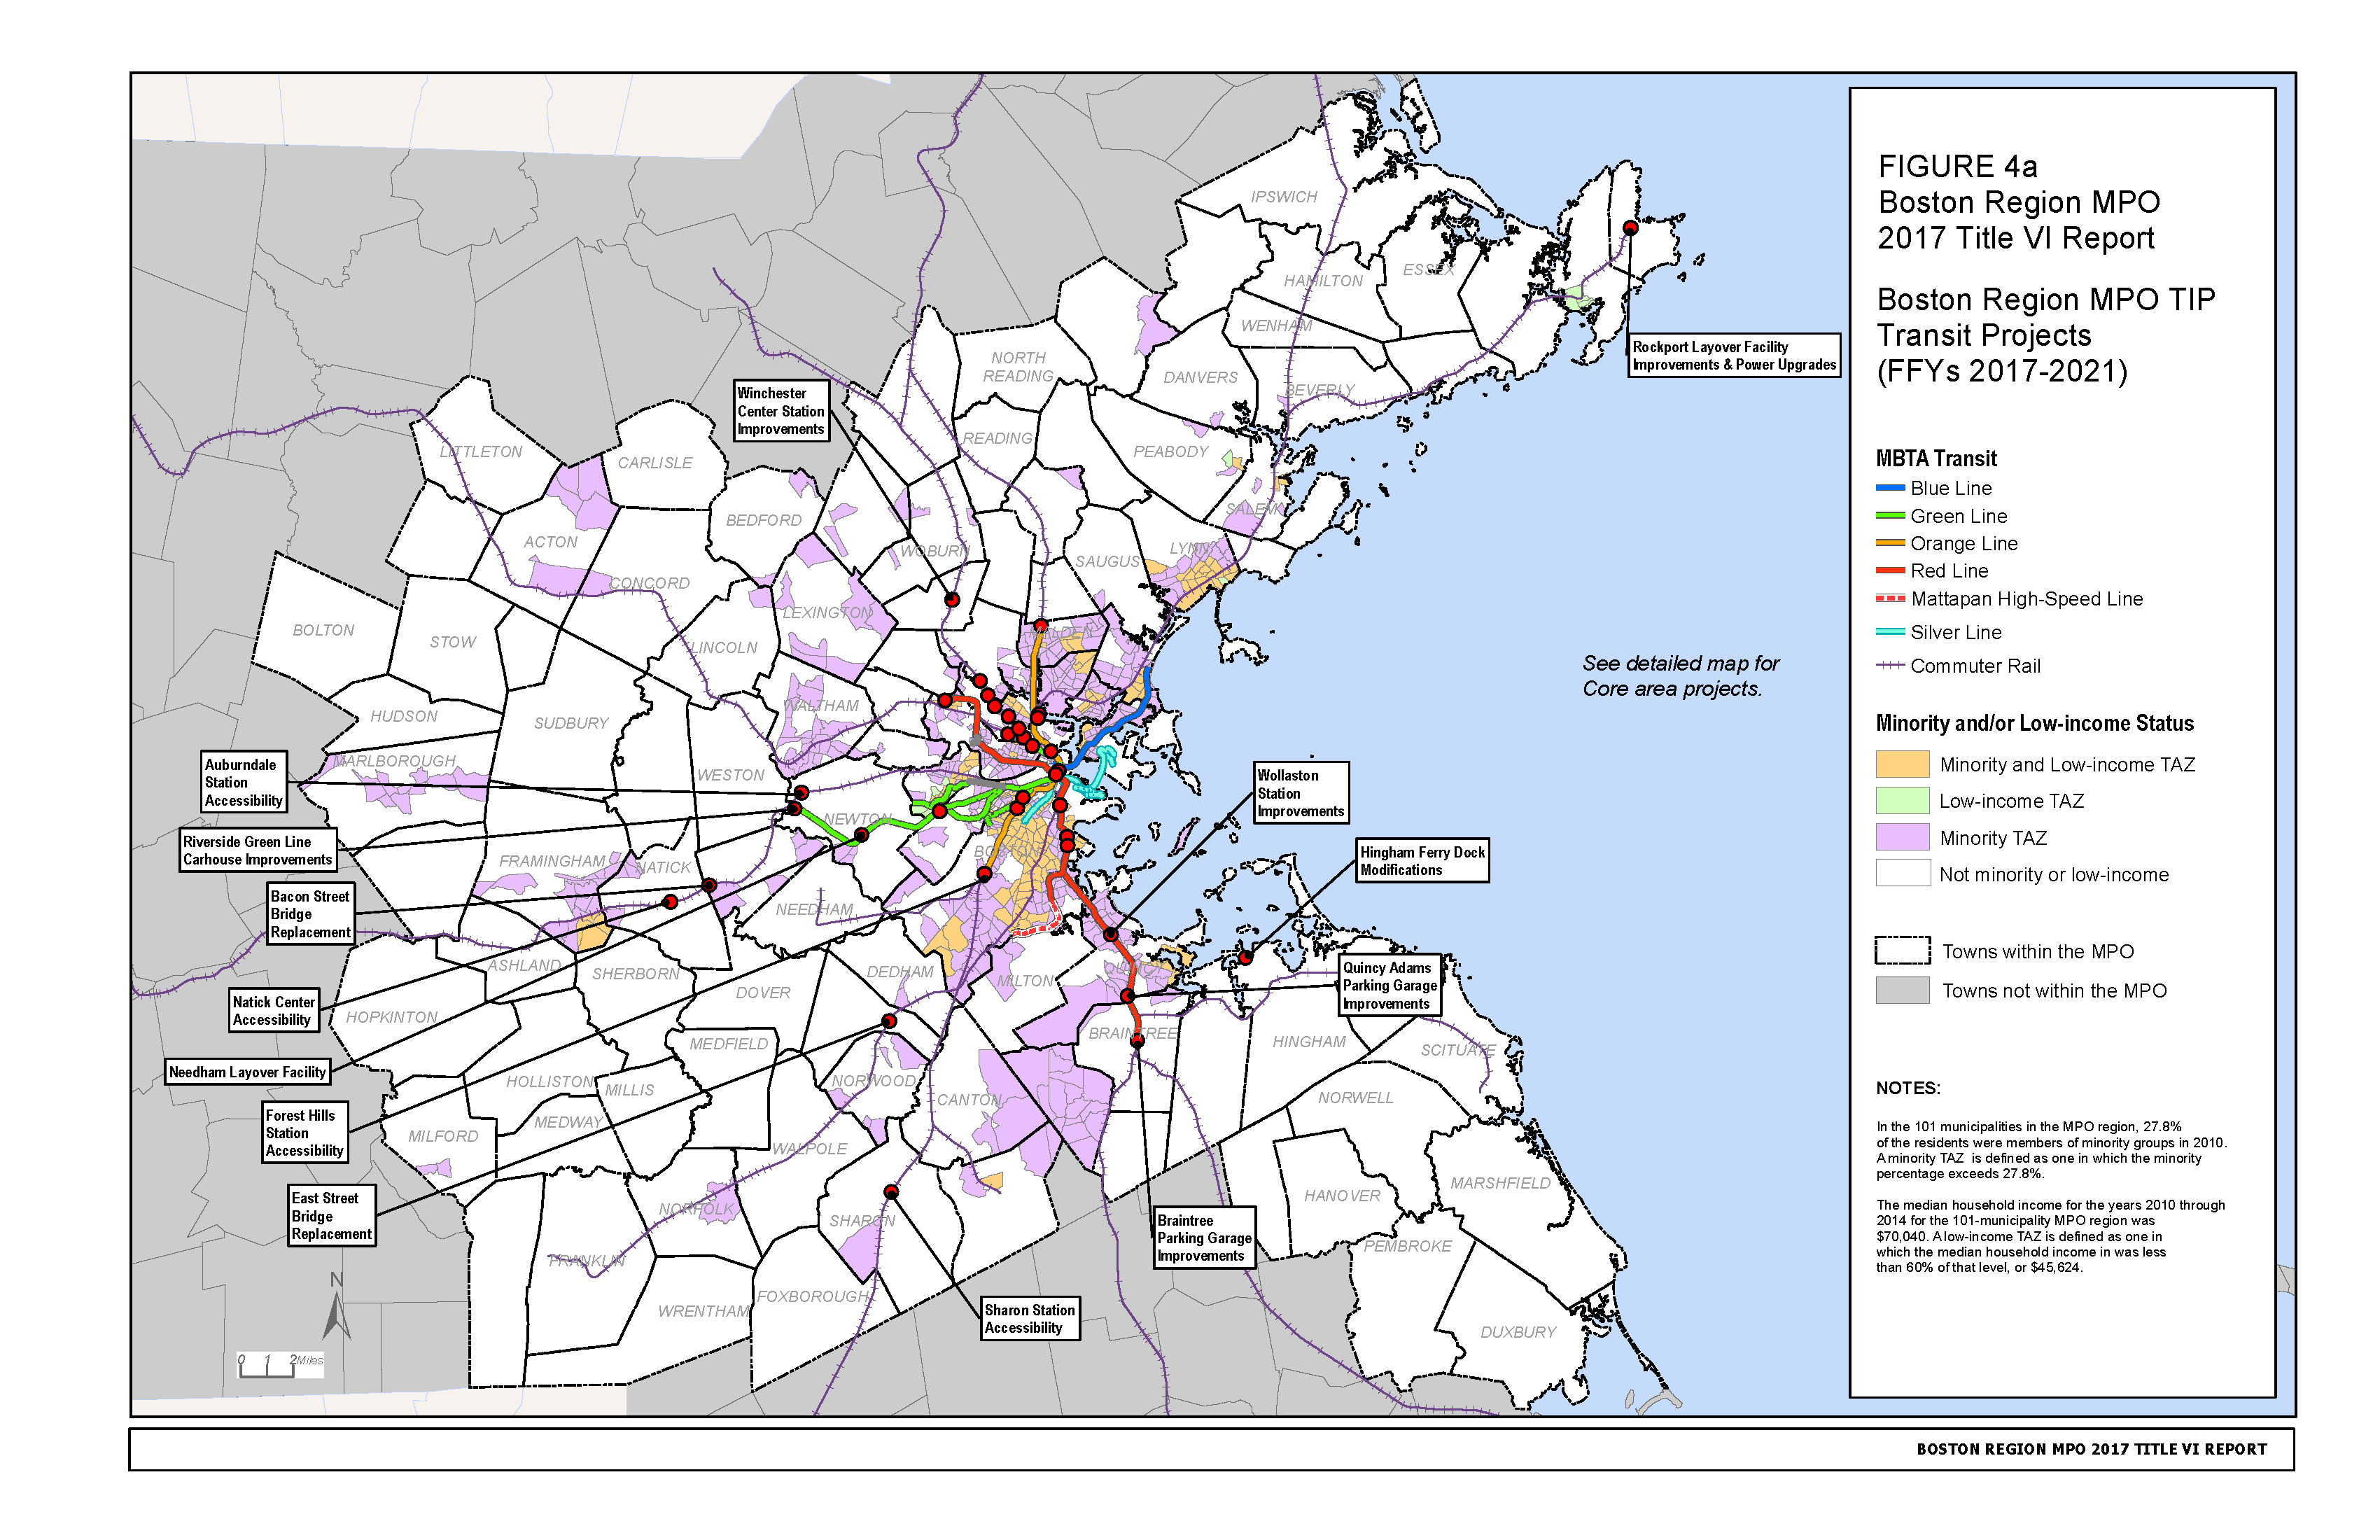
Figure 4b
Boston Region MPO TIP Transit Projects (FFYs 2017–2021): Detailed Map
In keeping with FTA Title VI requirements, the MPO analyzed the distribution to low-income and minority passengers of state and federal funds in the aggregate for public transit projects in the FFYs 2017–2021 TIP. Included in this analysis were MBTA, MetroWest Regional Transit Authority (MWRTA), and Cape Ann Transportation Authority (CATA) projects, as well as MPO target-funded transit projects. Projects were included only if they were expressly for transit purposes, such as infrastructure improvements, maintenance, and vehicle purchases, and if they were funded with state and/or federal dollars. Roadway improvements were not included, even if they would potentially benefit bus passengers. The analysis was performed with the assumption that all investments result in a net benefit to transit passengers.
Public transit ridership was derived from the 2008–2009 MBTA Systemwide Passenger Survey (SPS). Respondents were divided into four populations: low-income or non-low-income and minority or non-minority. Data from the 2010 Census and ACS were used to calculate thresholds for low-income and minority populations within the MPO because these data releases were concurrent with the SPS. Using data from the 2010 ACS, low-income respondents were those whose annual household income was less than 60 percent of the MPO region’s median household income of $70,829, or $42,427. (However, the SPS income category that most closely matched the low-income threshold was between $43,000 and $39,999. Therefore, any respondent who selected this category or a lower income one was considered low-income for the purposes of this analysis.) Minority respondents were those who reported being American Indian or Alaskan Native, Asian, Black/African American, Hispanic/Latino of any race, and/or Native Hawaiian or Pacific Islander in the 2010 Decennial Census. Tables 11 and 12 show the transit mode shares from the SPS for low-income, non-low-income, minority, and non-minority respondents. Note that the totals are not identical because of the variation in weights9 that were applied to each population.
Table 11
MBTA Ridership by Minority Status
| Transit Mode |
Minority |
Non-minority |
Percent Minority |
Pct. Non-minority |
|---|---|---|---|---|
Rapid transit |
81,183 |
203,518 |
28.5% |
71.5% |
Bus |
94,461 |
104,489 |
47.5% |
52.5% |
Commuter rail |
7,894 |
46,864 |
14.4% |
85.6% |
Commuter boat |
140 |
2,219 |
5.9% |
94.1% |
MBTA System Total |
183,678 |
357,090 |
34.0% |
66.0% |
Source: MBTA Systemwide Passenger Survey, 2008–2009.
Table 12
MBTA Ridership by Income
| Transit Mode |
Low-income |
Non-low-income |
Percent Low-income |
Pct. Non-low-income |
|---|---|---|---|---|
Rapid transit |
64,107 |
201,869 |
24.1% |
75.9% |
Bus |
74,127 |
104,666 |
41.5% |
58.5% |
Commuter rail |
3,602 |
46,682 |
7.2% |
92.8% |
Commuter boat |
97 |
2,006 |
4.6% |
95.4% |
MBTA System Total |
141,932 |
355,222 |
28.5% |
71.5% |
Source: Central Transportation Planning Staff; MBTA Systemwide Passenger Survey, 2008–2009.
The analysis compared the investment per passenger for the low-income population to that for the non-low-income population and the investment per passenger for the minority population to that for the non-minority population.
The following steps were taken to determine the investment per passenger:
Table 13 shows the total transit investments and percent of all transit investments for minority and non-minority passengers. The investment per passenger is shown in column five of Tables 13 and 14. Table 13 shows the total transit investments and percent of all transit investments for minority and non-minority passengers. Approximately 26.0 percent of the transit investments benefit minority riders, who consist of 34.0 percent of all public transit passengers within the MPO region. Although the investment per passenger for both low-income and minority populations is lower, compared to non-low-income and non-minority populations, respectively, this does not necessarily indicate that a disparate impact or disproportionate burden exists. The results should be compared over time to determine whether action by the MPO is necessary, and because this is a new analysis for the MPO, such a comparison is not yet possible. Additionally, the MPO plans to develop a DI/DB policy that determines whether the results of this analysis cause disparate impacts and disproportionate burdens.
Table 13
TIP Public Transit Investments by Minority Status
| Population |
Total Transit Investment |
Pct. of Investment |
Pct. of Passengers |
Per Passenger Investment |
|---|---|---|---|---|
Minority |
$742,979,926 |
26.0% |
34.0% |
$4,045 |
Non-minority |
$2,119,704,091 |
74.0% |
66.0% |
$5,936 |
Total |
$2,862,684,018 |
100.0% |
100.0% |
N/A |
N/A = Not applicable or available.
Sources: Central Transportation Planning Staff; MBTA Systemwide Passenger Survey, 2008–2009.
Table 14 shows the total transit investments and percent of all transit investments for low-income and non-low-income passengers. Approximately 22.8 percent of the transit investments benefit minority riders, who consist of 28.5 percent of the all public transit passengers within the MPO region.
Table 14
TIP Public Transit Investments by Income
| Population |
Total Transit Investment |
Pct. of Investment |
Pct. of Passengers |
Per Passenger Investment |
|---|---|---|---|---|
Low-income |
$653,743,689 |
22.8% |
28.5% |
$4,606 |
Non-low-income |
$2,208,940,328 |
77.2% |
71.5% |
$6,218 |
Total |
$2,862,684,018 |
100.0% |
100.0% |
N/A |
N/A = Not applicable or available.
Sources: Central Transportation Planning Staff; MBTA Systemwide Passenger Survey, 2008–2009.
In the FFY 2017 UPWP, the MPO initiated a geographical assessment of the distribution of MPO-funded UPWP studies and technical support activities. (Appendix H contains the complete analyses for the FFYs 2017 and 2018 UPWPs.) It showed which communities in the region have been the subjects of MPO transportation studies or recipients of technical support. For each municipality, the assessment documented the population that is minority and low-income, the number of UPWP tasks that have occurred in each FFY since 2010 and the municipality’s number of roadway miles.
The geographical assessment of the UPWP was revised slightly in the FFY 2018 UPWP, which contains additional TE data for each municipality, including the percent of the population that is minority or low-income, as well as the number of FFY 2018 UPWP studies. Not all municipalities have a study in any given FFY, but as the assessment that covers several years, it provides the MPO with a fuller picture of which municipalities that UPWP studies are and are not serving. Assessments for both FFYs excluded client-funded studies, which had a regional focus, and all work related to certification requirements and MPO administration, resource management, and support activities.
The assessments in the FFY 2017 and FFY 2018 UPWPs show how many studies each municipality and subregion has received. However, they do not identify which municipalities receive relatively more or less UPWP funding. Future assessments may address this issue, which could include analyzing the dollar amount spent per capita in each community, or the dollar amount spent per road mile. Other documentation could include the types of benefits that communities may receive from UPWP studies (such as congestion reduction), or the needs of communities, identified by either themselves, or the MPO’s LRTP.
The MPO consistently considers transportation equity when developing MPO-funded studies for the UPWP, programming projects in the TIP, and selecting projects for inclusion in the LRTP. These three documents are complementary and inform each other. For example, UPWP studies and technical support can inform the projects chosen to be in the TIP, as do the goals and objectives identified in the LRTP. Chapter 4 explains in detail how the MPO selects projects and studies for the UPWP, LRTP, and TIP, focusing on how transportation equity informs this process.
The MPO’s interdisciplinary TE program is the avenue through which the MPO considers the transportation needs of protected populations within the MPO region. Staff developed this program to enable the MPO to evaluate the transportation needs of these residents systematically and to incorporate these needs into the MPO’s multi-faceted work. The program builds upon and evolves according to the results of previous transportation-planning work and current demographic data, and strives to conduct up-to-date analyses about and provide information to Title VI and EJ populations (although it is not limited to these populations). Results are incorporated into and inform the MPO’s ongoing certification documents, as well as discrete studies completed by MPO staff.
The MPO’s TE program has evolved over time to respond to the changing federal requirements that underpin the program and to the diverse needs of residents in the Boston region. Originally designed to serve populations protected under Title VI of the Civil Rights Act of 1964, the program now also includes low-income populations, LEP persons, the elderly, and people with disabilities, zero-vehicle households, and female-headed households with children.
The MPO implements the TE program through three ongoing activities:
The second activity is discussed in Chapter Four, while the third activity is discussed earlier in Chapter Three. The remainder of this chapter discusses the process that MPO staff undertakes to complete the first activity, public participation. (Activities specific to the LRTP, TIP, and UPWP are discussed separately in Chapter Four.) The public participation part of the TE program is carried out in concert with the MPO’s public participation program; all of the public participation activities subsequently described are also cited in the MPO’s Public Participation Plan (PPP) (Appendix G), which was updated in October 2014. The MPO has recently expanded its outreach and communications capacity, which will enable it to strengthen its TE program.
The MPO’s communications strategy is multifold, as it makes use of several forms of communication, with the goal of reaching as much of the public and concerned organizations as possible. The MPO focuses on disseminating information about MPO board meetings; public outreach events; development or amendment of the LRTP, TIP, and UPWP; and opportunities for the public to submit comments.
The MPO’s website is the main way the agency distributes information about MPO activities, documents, and opportunities for public input, and for posting notices of public outreach events. The website is a broad resource, providing information about upcoming MPO events, meeting minutes (including those of the MPO board and Advisory Council), reports, and studies. It also contains extensive transportation data about the region, including The State of Boston Region Transportation Dashboard, which staff launched in 2017 to offer the public and stakeholders a visual representation of key transportation metrics in the region. The Dashboard was created in concert with the development of performance-based programming and planning (see section 4.5), and contains information about the region’s demographics, among other metrics. Website users are also invited to submit comments to the MPO electronically and to sign up for the MPO email lists and TRANSREPORT blog updates.
The MPO has begun using Google Analytics to track how users interact with the website. For the purposes of the MPO’s Title VI and TE programs, staff will, in FFY 2018, be able to identify the how many website visitors access accessible vital documents, download PDFs that are in languages other than English, and who view the website in languages other than English—including the exact pages they visit. Because the MPO has only recently begun systematically tracking and documenting this information, the results are not yet available. In concert with the MPO’s other outreach efforts, these data will help the MPO to identify the public’s translation and accessibility needs more precisely, and provide for them in a cost-effective way.
MPO staff post all documents on the website in both PDF and HTML formats to accommodate people with low or no vision. In addition, certification documents, MPO studies, informational materials, and notices may be obtained from the MPO in a variety of formats, including Braille and large-print. Members of the public may also requests meeting materials in accessible formats by email, telephone, fax, or US mail. The accessible versions of the MPO’s vital documents are posted in HTML and may be translated with Google Translate.
In accordance with the MPO’s LAP (Appendix D of this report), vital documents are translated into the three most commonly spoken non-English languages in the MPO region—Spanish, Chinese, and Portuguese. Vital documents include the notice of non-discrimination rights and protections to beneficiaries, complaint procedures, and complaint forms. In addition, the MPO has identified other vital documents to translate into Spanish, Chinese, and Portuguese. Currently, these include translations of the executive summaries of the MPO’s three major transportation-planning documents: the LRTP, TIP, and UPWP. As resources allow, the MPO will also translate vital documents into Chinese (traditional) and French Creole. Meeting notices in the form of web banners on the MPO website are also translated. Additionally, the MPO website has an embedded Google Translate widget that allows visitors to the site to translate web pages (including the HTML versions of all posted documents) into more than 100 languages, which includes all of the 19 safe harbor languages in the region.
In December 2016, the MPO published its final TRANSREPORT newsletter in print format; it has since transitioned to a web-based blog format on the MPO website in order to provide information in a timelier manner. TRANSREPORT informs readers about upcoming MPO events, news, and transportation issues relevant to the region.
Staff provides notifications to the public in a variety of ways, including via the MPO website, press releases for newspapers, Twitter, the TRANSREPORT blog, and email lists. Staff is will translate the MPO’s brochure that outlines our procedures and ways that members of the public may participate.
The MPO uses several email lists to notify interested parties about upcoming MPO meetings, document amendments, and other ways in which they may be involved in the MPO planning process. The MPO maintains six email lists: MPO Notices, MPO Meeting Reminders, Advisory Council Notices, Access Advisory Committee to the MBTA (AACT) Notices, TRANSREPORT, and Transportation Equity. Recently the email lists were overhauled and transferred to an email delivery service. Subscribers now can manage the lists to which they belong and customize the frequency of communications that they receive from the MPO more easily. The MPO can gauge the success of its messaging strategies better, and can respond to the needs and interests of subscribers more rapidly.
Subscribers to the transportation equity email list also benefit. The list disseminates information about upcoming MPO events, meetings, and other activities related to transportation equity at the MPO. Staff can now easily provide translations of emails to those who require it for announcements that the MPO deems vital, such as upcoming TIP and LRTP amendments and MPO meetings. As subscribers now have direct control over which email lists they subscribe to, those who may not be aware of the transportation equity list will have the opportunity to sign up. Combined, the email lists currently have approximately 3,036 subscribers, with the transportation equity list having about 366 subscribers.
Currently, to help LEP email recipients to stay informed of MPO activities, staff customize emails pertaining to vital documents and activities (such as, public comment periods) so that the email can determine whether the recipient’s internet browser is set to Spanish, Portuguese, or Chinese; if it is, the email will be automatically translated into that language using professionally translated material that staff provides. This is a very resource-intensive effort, given the cost of translations and the number of emails that the MPO sends. Staff intend to add to the MPO website’s email list sign-up form an option for subscribers to select the language in which they would like to receive email communications. Based on the requests of email recipients, staff will decide for which languages email translations will be provided. To ensure that non-English language access is available, a link will be provided in every MPO email notifying recipients that they can receive translations upon request. This will reduce the burden on staff resources and time, while still allowing email recipients to receive translated emails if necessary.
The MPO opened its official Twitter account in 2010 to improve its communication with the public. Staff uses Twitter regularly, largely to advertise upcoming public events, including MPO board meetings, public outreach events, non-MPO transportation-related events of interest, upcoming office hours with MPO staff, completion of transportation studies, and commendation that staff receives for its work. With 725 followers, the MPO’s Twitter account has developed into a news source for transportation planning in the region. Meeting notices and links to other vital documents posted on Twitter also are translated. Given that these translations are not very resource-intensive, staff will continue to provide Twitter translations for key notices regarding vital documents.
The MPO takes a proactive approach to identifying transportation equity issues in the region, including identifying new contacts that represent or are involved in transportation equity; strengthening existing relationships; collecting, analyzing, and reporting relevant data and information about transportation equity in the region; and facilitating transportation equity populations’ participation in the MPO’s transportation-planning process. In addition, MPO staff provides administrative support to the Advisory Council and AACT.
Central to the success of the MPO’s Public Participation Program is the development and maintenance of several contact databases, including one specifically for transportation equity contacts. These databases are used to inform the public about opportunities to become involved in developing the MPO’s LRTP, TIP, and UPWP, as well as to invite contacts to participate in MPO-hosted events such as equity forums, surveys, or focus groups. The biggest challenge has been ensuring that attendees are representative of the region’s diverse communities. The MPO plans to address this challenge by using these contact databases to identify potential partners for MPO-hosted events so that the MPO can expand its reach.
Further, while the MPO has found that most attendees of MPO-sponsored events hear of the event through email, there may be populations that have limited or no access to email and therefore are not represented at MPO events. So, under the public participation program, staff will explore the possibility of utilizing non-email communications such as paper advertisements. Conversely, the MPO has had success in ensuring that municipalities within the MPO are notified of and represented at MPO events. Switching to a new electronic communications tool, MailChimp has greatly facilitated this success, improving the regularity and comprehensiveness of the MPO’s communications. The MPO’s ongoing initiative is to increase the number of contacts in its transportation equity outreach database, strengthen partnerships with existing contacts, and ensure that the database represents the region’s diversity.
MPO staff regularly identifies new community contacts involved in and knowledgeable about the transportation needs of transportation equity populations, many of whom are identified through the MPO’s TE contact database. These contacts include social service organizations, cultural organizations, community development corporations, civic groups, transportation advocates, councils on aging, environmental groups; immigration services establishments, and civil rights organizations. The MPO’s TE database tool tracks the types of organizations and which TE populations they represent. Using this tool, which is hosted in the cloud using Google Sheets and Google Fusion, staff can easily see which geographic regions these organizations belong to and which types of organizations are missing from the list. This enables staff to target outreach to organizations that may benefit from being informed of MPO activities and involved in the MPO planning process. In the past year, more than 30 organizations have been added to the TE contact database—which includes organizations that staff have identified as having missions that align with the MPO’s transportation equity program, whether or not they have chosen to subscribe to the TE email list—several of which have been added to the TE email list and/or have met with MPO staff. These include Transportation for Massachusetts, MassMobility, Neponset Valley Regional Coordinating Council, and AARP.
To ensure that the MPO continues to expand this network, staff attend out-of-office meetings, conferences, other professional networking events, and follows up with new contacts to foster their continued engagement with MPO activities. These events often result in new contacts being added to the MPO’s TE outreach database for ongoing involvement, as well as the transportation equity email list. As needed, staff schedules one-on-one meetings in order to identify areas of common interest and potential collaboration. The most successful of these have been those events with an interactive component—whether it’s an opportunity for networking prior to a conference or a meeting that involves group discussions. Staff will continue to meet with organizations that have been identified as key partners and who have the interest and capacity to further the transportation equity mission of the MPO. Future planned activities will include staff attendance at events that focus on the transportation concerns and needs of TE populations. For example, staff has attended and will continue to attend meetings of Massachusetts regional coordinating councils that are within the MPO region. Staff will also attend events as speakers or by tabling, as opportunities arise, in order to inform the public about opportunities for participation in the MPO’s planning process. Finally, staff will also reach to organizations that they think would be interested in the MPO’s work to inquire about attending one or more of their meetings.
MPO staff collects information about the transportation needs of Boston residents from a variety of data sources. The most important source of information is the United States Census Bureau, specifically the ACS and Decennial Census. Other data sources are being explored, such as education data from the Massachusetts Department of Elementary and Secondary Education regarding LEP students. MPO staff is committed to ensuring that data used in the TE program are the most up-to-date data available and that data analyses reflect best practices in transportation planning. In that regard, staff track and integrate innovations in transportation planning into the TE program regularly.
Staff also receives written and oral comments from the public as part of the TIP, LRTP, and UPWP public participation processes, as well as from specialized TE events and meetings. MPO staff interprets, summarizes, and classifies the needs identified by participants, and incorporates them into the MPO’s TE program.
Perhaps the most substantial way for transportation equity populations and other members of the public to be involved is through the public outreach process of the MPO’s LRTP, TIP, and UPWP. Members of the public have an opportunity to comment on these documents throughout their development; during this time, MPO staff holds public meetings throughout the region, hosts regular office hours (that is, open visiting hours), and provides an opportunity for written public comments upon completion of the draft documents. Details about this process for each of the three documents are described in Chapter Four.
Location-specific public outreach, such as public meetings, may be located in areas that have distinct language needs. Therefore, staff uses demographic data to identify other languages that the relevant meeting documents and notifications may need to be translated into. Additionally, MPO staff is tracking changes in languages in the region, and are committed to expanding translations to other, non-vital documents as well as into other non-English languages beyond the three most commonly spoken as resources allow. Staff will continue to explore the possibility of providing translations of these documents in other languages. These translation policies are consistent with the MPO’s public participation policies as identified in the MPO’s PPP.
The MPO makes all meetings accessible to people with disabilities and to those without access to a vehicle. All MPO-sponsored meetings are held in locations that are accessible to people with disabilities and are near public transportation. To ensure accessibility for people with disabilities, locations for meetings held outside of the State Transportation Building are selected based on the results of an on-site visit. As part of this review, MPO staff uses an accessibility checklist with a list of physical characteristics that are necessary to accommodate individuals with a variety of mobility and other disabilities.
For many years, MPO staff has provided administrative support to AACT, which is a consumer advocacy organization that strives to ensure that the public transit system in Boston is accessible, in accordance with the ADA. AACT is composed primarily of people with disabilities, seniors, and representatives of human service agencies. The MBTA is currently working with ACCT and another group of advocates who have been deeply involved in monitoring the settlement agreement with the Boston Center for Independent Living (BCIL), which committed the MBTA to undertaking major improvements to the accessibility of the system. It is anticipated that the two groups will merge to form a single organization. It is unclear whether or not MPO staff will continue to provide direct support to the new organization. However, staff will definitely maintain close contact with the group to better understand and serve the needs of the disability community in the Boston region.
In 2015, the MPO hosted a National Transit Institute (NTI) Environmental Justice training course that several MPO staff members attended; and in 2017, the MPO’s Transportation Equity Program manager participated in the two-day Advanced-Level Environmental Justice Workshop. In addition, those on staff with expertise related to environmental justice and Title VI regulations have led workshops for all staff to educate them about equity issues and how those issues relate to the work of the MPO. Further relevant staff trainings and workshops will build upon these efforts.
The MPO will continue to work to enhance its public outreach to TE populations and organizations that represent the transportation needs of these populations. Using the TE contact database tool, staff will be more systematic in their approach to TE outreach. The tool will be used to identify gaps in the contact list (for example, a lack of organizations representing the disability community or those representing Spanish language speakers) and to identify organizations that represent these populations and that might want to be informed by about the MPO’s work. MPO staff will then reach out to these organizations to set up either one-on-one meetings or attendance at their regular member meetings. Staff will also continue to attend events such as conferences to help establish additional connections with TE organizations that are not represented in the TE contact database, and further integrate Title VI work with the MPO’s public participation program. Staff will strengthen partnerships and conduct transportation equity-specific outreach to help inform TE populations about MPO activities and ways that they may participate in the planning process.
Staff will also continue to refine its equity analyses for the LRTP and TIP. In order to improve the effectiveness of these analyses, staff will undertake to efforts to refine current methods and develop novel approaches, with particular emphasis on off-model analyses. These efforts will enable the MPO to ensure that projects selected for inclusion in the TIP and LRTP do not cause disparate impacts or disproportionate burdens for minority and low-income populations, respectively.
The purpose of this chapter is to provide an overview of the MPO’s 3C planning process and to highlight how Title VI, EJ, and other non-discrimination mandates are incorporated into planning activities to engage and include diverse populations and perspectives.
Work for the metropolitan transportation-planning process is underway all year, largely centered on the three major certification documents that are developed on a regular schedule: the TIP, UPWP, and LRTP. The development of these documents follows established cycles as depicted in Figure 5, and includes significant public outreach at all stages. MPO staff makes the public aware of the opportunities to be involved with the planning process at the beginning of each federal fiscal year, highlighting key document development milestones and MPO actions. Additional opportunities for participation in the MPO’s other programs, such as the TE program, occur throughout the year, as needed. In addition, project selection for all three documents reflects the goals of the MPO, one of which is to ensure equity, as it relates to Title VI, EJ, and other protected populations, in the selection of its projects.
Figure 5
Boston Region MPO Planning Process
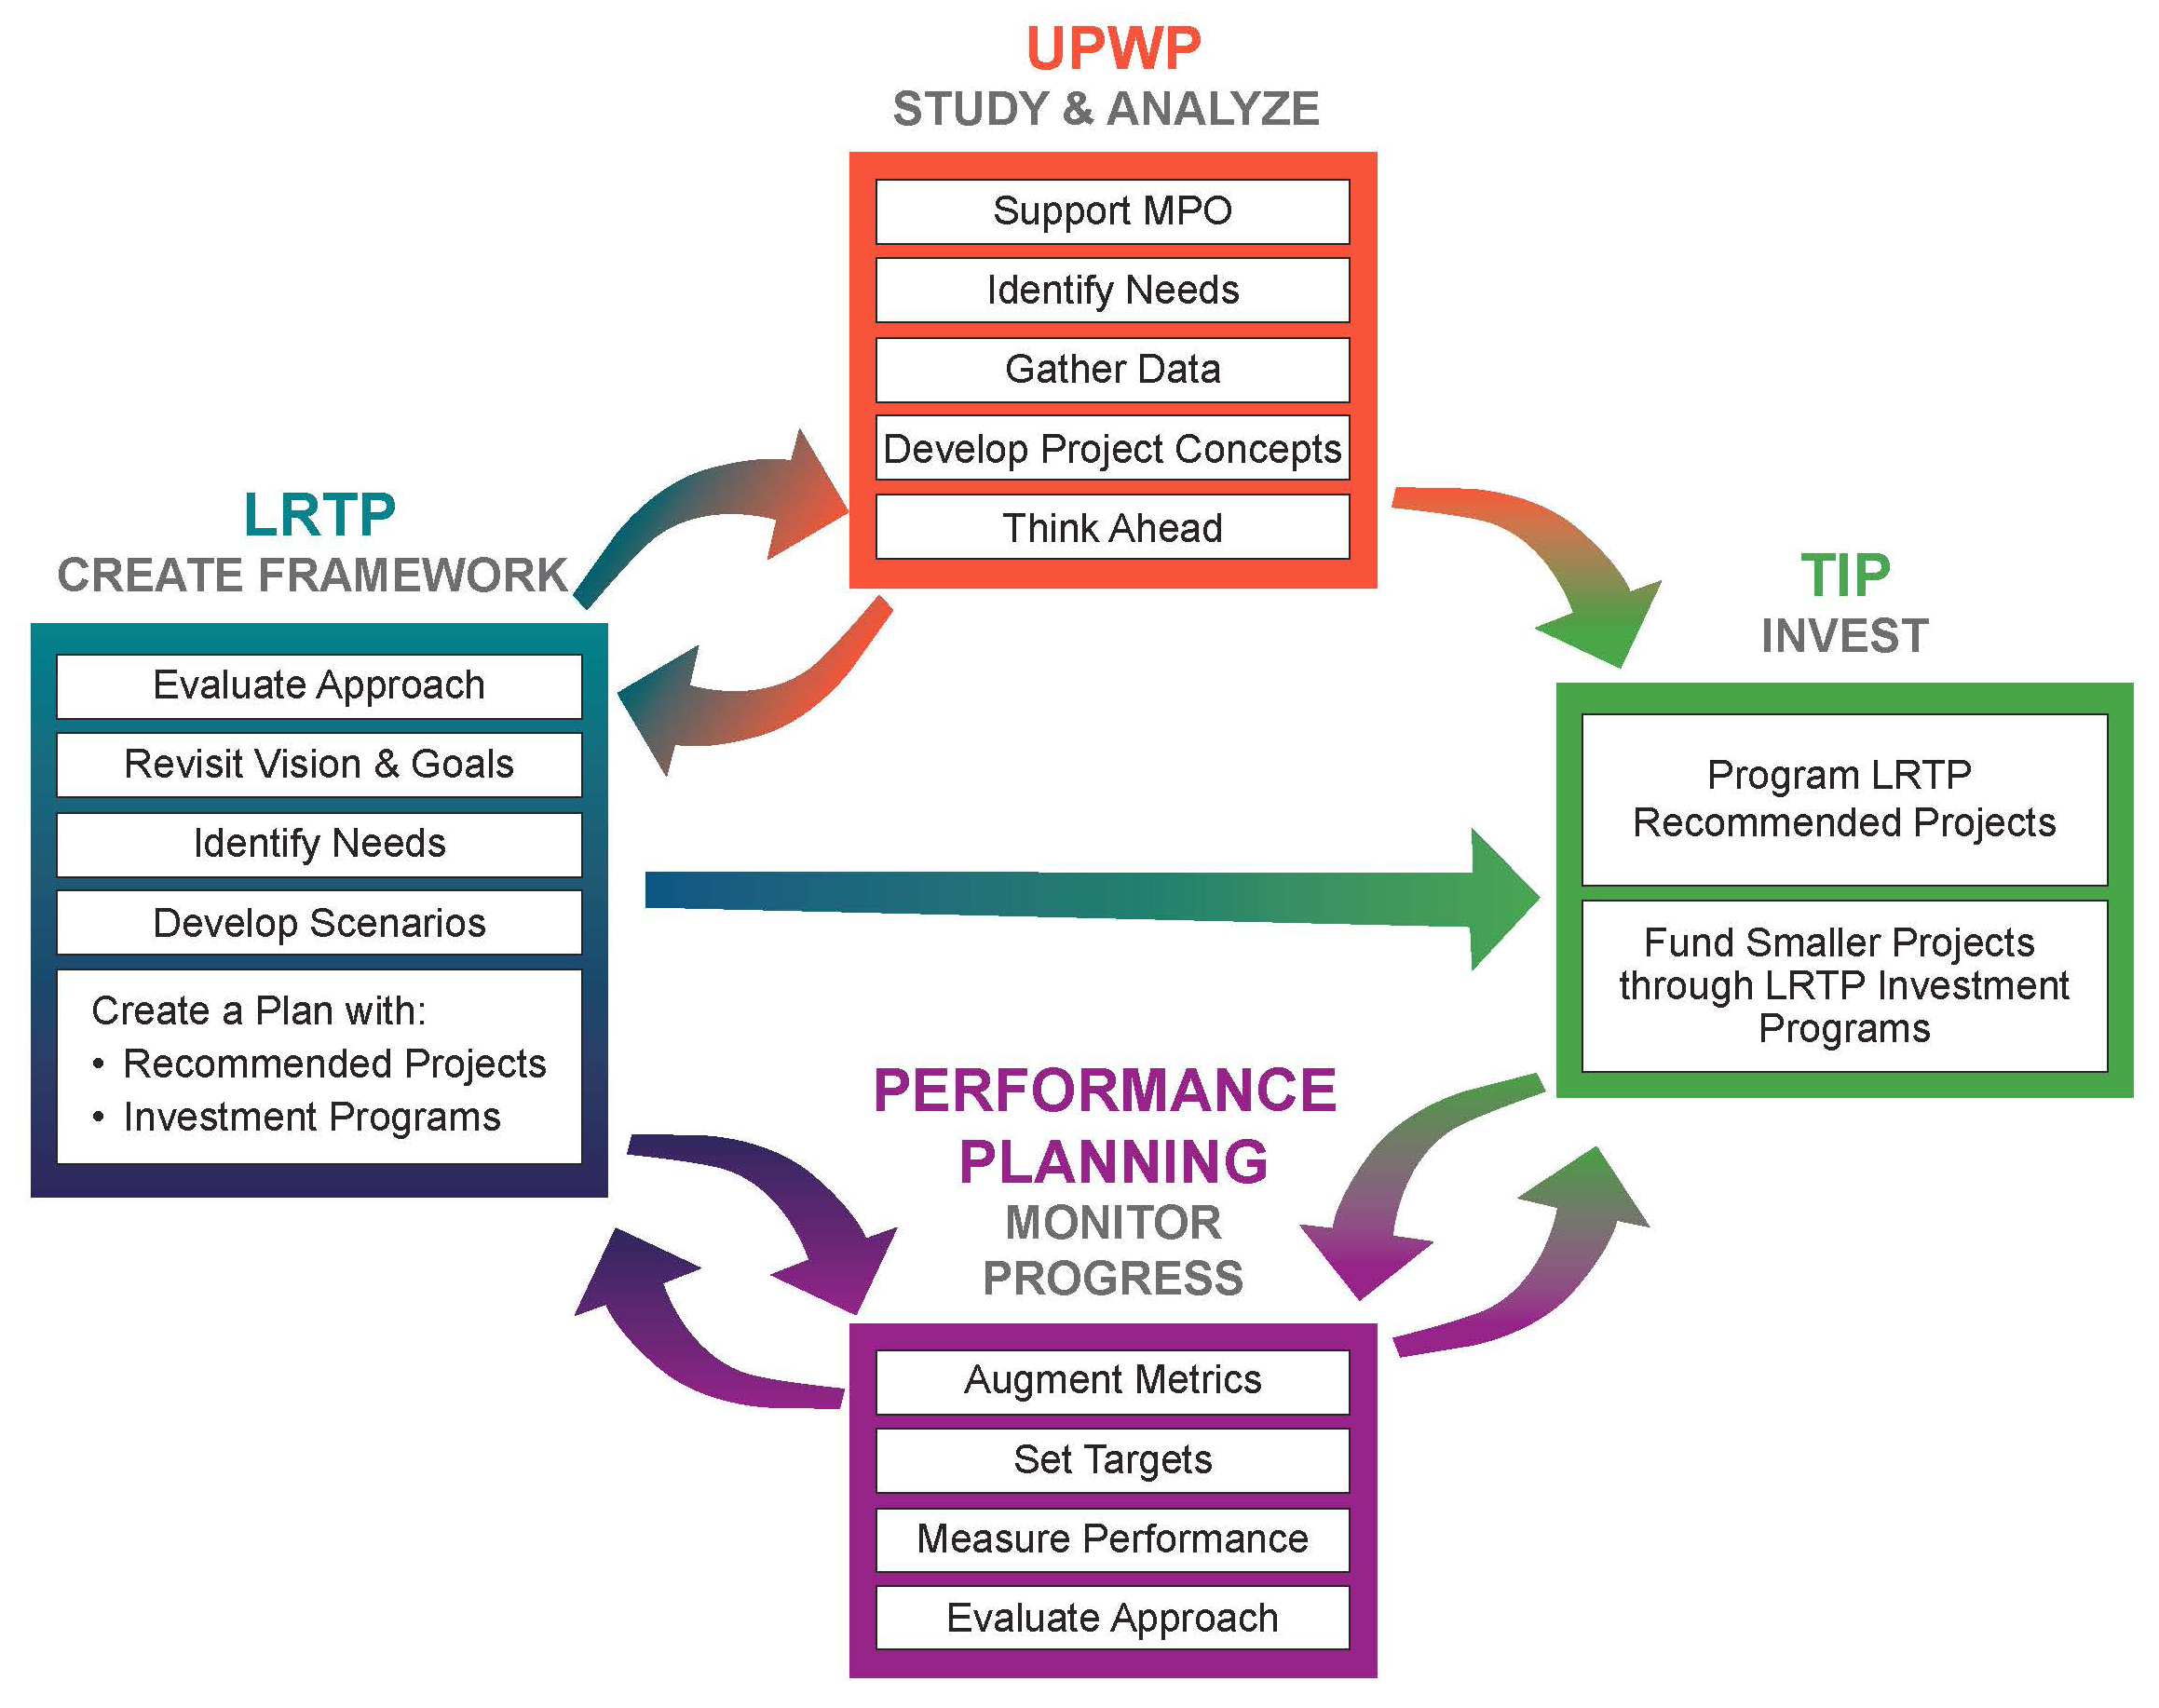
For development of the current LRTP, Charting Progress to 2040, the MPO began to shift its transportation investment focus from large infrastructure projects to smaller-scale projects that emphasize public transit, walking, and bicycling. This new course reflects the reality of current fiscal constraints in the Boston region, as well as the transportation interests and needs of the area’s residents to prioritize funding of a multimodal, sustainable transportation system. To that end, the MPO established a new overarching transportation vision for the future:
A modern transportation system that is safe, uses new technologies, provides equitable access, excellent mobility, and varied transportation options—in support of a sustainable, healthy, livable, and economically vibrant region.
Additionally, Charting Progress to 2040 established six goals that serve as a guiding framework not only for selecting projects for the LRTP, but also for prioritizing TIP projects and developing studies for inclusion in the UPWP.
The six goals are:
These goals will steer the region toward its 2040 vision by helping the MPO prioritize studies in the UPWP and projects in the LRTP and TIP over the next 20-plus years. They will also help the MPO develop metrics with which to measure and track performance improvements in the transportation system.
The UPWP, published every year, describes how the Boston region’s federal transportation-planning funds will be spent in a given FFY to ensure that the work undertaken by staff reflect the priorities of the MPO as expressed in the LRTP. The UPWP identifies funding that will be used to implement each component of the transportation-planning process that is required for certification, including the development of the LRTP, the TIP, and air quality conformity determinations. The UPWP also details discrete transportation-planning studies, ongoing programs, and technical assistance activities that are federally funded and performed by MPO staff. In addition, the Boston Region MPO’s outlines all UPWP expenditures for support and administrative services and includes information on work performed by staff under contract to transportation agencies.
Each year, new studies are selected for funding in the UPWP. MPO staff develops a Universe of New Studies, from which final studies to be included in the UPWP are selected by the MPO’s UPWP Committee. Ideas for the new studies are gathered from public events in the fall and winter of each year, including MAPC subregional meetings with municipal officials, as well as from the Advisory Council and the UPWP Committee. In addition, study ideas are generated from existing transportation issues documented in various other MPO and other state agencies’ plans; FHWA and FTA planning emphasis areas; public comment letters; consultations with MassDOT, MBTA, and the Metropolitan Area Planning Council; and MPO staff-identified needs.
Each proposed study in the Universe of New Studies is evaluated based on the following criteria:
In the spring the draft of the UPWP is released for 30-day public review and comment period. The document is available on the MPO website and staff provides notice of its availability through its several communications outlets. (For the FFY 2018 UPWP, the public comment period was amended to 21 days. The length of the public comment period will be revisited by the MPO for FFY 2019. See Appendix G for the text of this amendment in the Public Participation Plan.)
The MPO regularly selects studies for inclusion in the UPWP that address transportation needs of Title VI and EJ populations. The following is a list of studies and MPO work programs that have been funded in the past three years:
Every year, the Boston Region MPO develops a TIP that programs transportation investments over the next five-year period. Three TIPs were finalized within the time frame of this triennial report: FFYs 2015–2018, FFYs 2016–2020, and FFYs 2017–2021. TIP project selection is guided by the MPO’s vision, goals, and objectives stated in the LRTP: prioritizing investments that preserve the current transportation system in a state of good repair, providing safe transportation options for all modes, enhancing livability for residents, and improving mobility throughout the region. Additionally, the TIP often implements recommendations from past studies or reports that were funded through the UPWP. In this way, the three planning documents work together to achieve the MPO’s vision for the region’s transportation network in a cohesive and comprehensive manner.
Each year, the MPO considers additional projects for funding. To select which projects will be funded with the MPO’s discretionary funds, the MPO uses a set of project evaluation criteria, which are linked to the six LRTP goals, to identify and prioritize projects that advance the MPO’s vision; one of the criteria categories is transportation equity. The remainder of this section describes how projects are selected for the TIP, focusing on the role that transportation equity plays in the selection process.
Public outreach for the development of each new TIP begins in late fall when MPO staff notifies the 101 municipalities in the region of the start of the TIP development process and asks them to identify projects to be considered for funding. During that time, staff attends meetings in each of the MPO’s subregions to inform municipalities and the public about the TIP process and to gather project feedback. MPO staff then compiles applicable project funding requests into a Universe of Projects list, which, when finalized, is released to the public and municipalities for their feedback. The list includes projects that have been initiated through the MassDOT project development process and have reached a design stage where there is enough information available for MPO staff to evaluate the projects. To ensure that project information is current and accurate, MPO staff coordinates with municipal and TIP contacts to update information for each project in the MPO’s online TIP project database, which provides information about estimated cost, development status, and contribution of the project to the MPO’s goals.
Staff uses the MPO’s TIP evaluation criteria to choose which projects from the Universe of Projects to recommend for programming in the TIP. Criteria are divided into six categories, which are the same as the six LRTP goals. A project can earn a range of points from each criterion (the maximum number of points is 134), based on the planned design of the project. A project’s evaluation score is one of several important factors that help MPO members understand the priority of projects and decide which to program for funding. The transportation equity criteria assess whether a project serves one or more EJ, Title VI, and other protected populations, as well as whether it creates a burden on these populations. A total of 12 points is possible.
The transportation equity criteria are:
The thresholds used to identify these populations are those described in Chapter Three’s demographic profiles. They are updated as new ACS and Decennial Census data become available. TIP criteria were recently updated to reflect the MPO’s priorities identified in the LRTP, Charting Progress to 2040. When the criteria will next be updated has not been determined. At that time, staff will consider the outcomes of the equity analyses, public outreach, and other results of its transportation equity program when developing new transportation equity criteria to ensure projects selected for the TIP reflect the MPO’s transportation equity goals and objectives.
MPO staff uses the evaluation ratings and project readiness information to prepare a First-Tier List of Projects, which includes all the information that staff will consider when selecting projects for the TIP. This includes evaluation results, inclusion in the LRTP, geographic distribution of investments, fiscal constraints, and project readiness.
After approval by the MPO board, staff releases the draft TIP for a 30-day public review and comment period. Members of the public, government officials, and other stakeholders are invited to review and comment on the proposed program. After the comment period ends, the MPO reviews all comments and makes changes to the document as appropriate. The MPO board then endorses the TIP and submits it to FHWA and the FTA for federal approval by the end of the FFY, September 30.
In FFY 2017, MPO staff undertook a UPWP study to develop an analysis of the TIP that determines whether TIP projects in the aggregate cause disparate impacts or disproportionate burdens to minority and low-income populations, respectively. This process is described in detail in Chapter Three.
The LRTP states the MPO’s transportation policies and goals and lays out a program for preserving and expanding the region’s transportation system for a 20-year-plus period. It is fiscally constrained so the MPO must select projects that best reflect both the goals of the MPO and the region’s transportation needs.
The Boston Region MPO approved Charting Progress to 2040 in 2015.The plan focuses on six goals described in the beginning of this chapter. These goals and their related objectives steer the region toward its transportation vision by helping the MPO to prioritize studies in its UPWP and projects in its TIP. These same goals and objectives will help the MPO develop metrics with which to measure and track performance of the regional transportation system.
Under the LRTP’s Transportation Equity goal, three objectives were established:
Charting Progress to 2040 represents a major departure from previous LRTPs completed by the MPO. The MPO re-evaluated its past practices to ensure that the LRTP reflects the MPO’s revised vision. By doing so, the MPO moved away from programming large-scale capital projects to reduce congestion; instead, it set aside more funding for smaller operations-and-management (O&M) roadway improvements to manage roadway capacity for projects that support bicycling, pedestrians, and transit.
After identifying the goals and objectives that would guide the LRTP, MPO staff assessed the region’s transportation needs based on an inventory of its transportation issues. Among those identified in the realm of transportation equity were coordination of transportation services, transit service improvements, and improved intermodal connections.
The third step in the LRTP planning process was to analyze the transportation investments that the MPO should make between 2015 and 2040. Staff undertook analyses of three future scenarios—current investment patterns, O&M investments, and high-capital investments—to shed light on their relative merits. Ultimately, the O&M investments scenario proved to be most beneficial to the region. Within that scenario, 180 projects would be located in Title VI areas.
The final step was to select projects and programs to include in the LRTP. As with the TIP, staff compiled a Universe of Projects and Programs, a comprehensive list of potential highway and transit projects that could be included in the final LRTP.
Each was associated with one of the six program areas of the O&M investments scenario:
Priority was given to O&M programs and projects beginning in the FFYs 2021–2026 time band of the LRTP, after the existing TIP commitments had been funded. Final selection of projects by the MPO was based on information gleaned through the LRTP development process, including: the regional needs assessment, scenario planning process, project studies (such as, modeling work, environmental impact statements), and public feedback from the LRTP public outreach process.
The MPO sought to break down barriers to participation for people who have historically had limited involvement in development of the LRTP, including minorities, low-income persons, people with disabilities, and those with limited English proficiency. Public outreach targeted individuals and organizations that represented the interests of these populations, including social service organizations, community development corporations, civic groups, environmental groups, EJ and civil rights groups, and the state’s regional coordinating councils. The MPO maintains a list of these contacts, and regularly provides them with general information about the MPO, and informs them about specific ways they can be involved in the MPO’s transportation-planning process.
Initial public outreach for the LRTP began in 2014 with a series of public meetings to solicit comments on the MPO’s revised PPP, held in areas with a large number of LEP, minority, and low-income residents. These meetings set the stage for LRTP-specific public outreach. Subsequent emails kept attendees and other contacts apprised of all opportunities for participation in LRTP events and public outreach efforts. Events included public meetings, workshops, and forums throughout the year-and-a-half preceding the MPO’s endorsement of the LRTP, where transportation equity was a major topic of discussion. Notices for all MPO-sponsored public meetings were translated into the three most widely spoken non-English languages in the MPO region: Spanish, Portuguese, and Chinese.
Charting Progress to 2040 includes equity analyses of the set of projects included in the LRTP. MPO staff used the regional travel demand model to perform two types of equity analyses—accessibility/mobility and congestion/air quality—to determine whether low-income and minority populations would be subject to disproportionate burdens or disparate impacts, respectively. (These are described in more detail in Chapter Three and in Appendix F of this report.) MPO staff continuously examines, and updates when necessary, this analytic methodology, ensuring that it reflects best practices in the transportation-planning field.
Moving Ahead for Progress in the 21st Century’s (MAP-21) introduced the requirement that MPOs implement performance-based planning and programming (PBPP) practices, including performance measures and targets to track and report on progress toward regional transportation goals and objectives. The Boston Region MPO’s transition to PBPP is currently underway. It is an ongoing process and will continue to evolve as the MPO monitors and evaluates its progress. As one of the MPO-wide goals, transportation equity is part of the MPO’s PBPP. Staff tracks transportation investments in minority and low-income communities to ensure that all areas of the region benefit from the programming of federal dollars.
One of the initiatives undertaken in support of performance based planning is the development of a performance dashboard. The web-based dashboard includes several types of transportation data, including demographics for TE populations; bicycle infrastructure; pavement and bridge conditions; and roadway congestion. Presently, the demographic data only reflects the latest figures; in the future, the MPO anticipates updating it to include information from past years, and, as appropriate, other equity-related data. As the dashboard evolves, its underlying data will be updated and data for new performance measures will be added.
The PPP describes the MPO’s Public Participation program, which comprises the various public outreach and communications activities in which the MPO engages to ensure that all members of the public are given the opportunity to participate in the metropolitan transportation-planning process. The PPP specifically identifies ways in which the MPO promotes participation among populations that have been historically underserved by the transportation system and/or have lacked access to the decision-making process. The PPP guides the MPO’s efforts to offer early, continuous, and meaningful opportunities for the public to help identify social, economic, and environmental impacts of proposed transportation policies and projects. The vision and goals of the program are integrated with the certification activities—TIP, UPWP, and LRTP—that the MPO undertakes.
The MPO has established a vision that guides its public participation efforts in the region: to hear, value, and consider—throughout its planning and programming—the views of and feedback from the full spectrum of the public, and use this input in its decision-making. In support of this vision, the MPO has established a number of public participation guidelines.
The MPO makes every effort to:
Some of the MPOs efforts that are described in the PPP are also described within this report. Chapter Three discusses how the MPO’s public outreach and communication efforts are applied specifically to EJ and Title VI populations. Additionally, the PPP describes the public participation schedule for the MPO transportation-planning processes, which are summarized in this report’s Chapter Four. The MPO updated the PPP most recently in 2014; followed by an amendment in 2017; it is included in Appendix G of this report.
1 The Massachusetts Department of Transportation is the primary recipient of the funding form FTA and FHWA, and the MPO is a subrecipient of the funding through MassDOT.
2 Poverty statistics and other data for the Boston region are reported in the 2010–2014 American Community Survey and vary based on household size. Using the household as the unit of measurement (which the MPO uses in the form of annual household income), instead of individual income measures, accounts for the economies of scale inherent as household size increases.
3 The FTA requires that MPOs submit documentation of their Title VI effort every three years. As a measure of expediency, the Boston Region MPO combines reporting efforts to FHWA with those to FTA.
4 After completing the 2015–2018 TIP, the MPO changed the time frame of its TIPs to five years from four years.
5 Central Transportation Planning Staff (CTPS) is the name of the staff to the Boston Region MPO.
6 Because ACS data must be adjusted to the 2010 census population and household totals, the MPO will continue to use 2010–2014 ACS data until 2020 Census data is released, as it is the last ACS release that contains 2010 survey data.
7 “Less than very well” includes individuals who report to the U.S. Census Bureau that they speak English “well,” “not well,” or “not at all.”
8 Data suppression inherent to language tables in the ACS causes LEP totals from these data to differ from those in the ACS tables from which overall English language proficiency is derived. The total LEP population from the language tables is 310,999, while the LEP population estimate is 311,134 from the English language proficiency tables. To address this issue, the MPO uses overall English language proficiency totals when calculating the LEP population for the region, and uses the language LEP population when identifying safe harbor languages.
9 The SPS only sampled a portion of the total ridership. Therefore, the survey responses from each station or route were weighted to equal typical boardings during the survey hours using the most recently available ridership figures.