Technical Memorandum
DATE: August 18, 2016
TO: Boston Region MPO Congestion Management Process Committee
FROM: Ryan Hicks
RE: Creating Congestion Scans with INRIX Data
The purpose of this memorandum is to summarize the development of roadway congestion scans as part of the continuing congestion management process (CMP), which requires the duration, extent, intensity, and reliability of congestion to be measured on roadways in the Boston Region Metropolitan Planning Organization (MPO) area. Duration, intensity, and reliability are calculated using performance measures that are displayed in the Express Highway Performance and Arterial Performance Dashboards. MPO staff created these dashboards in 2014 using a 2012 INRIX dataset. However, at that time, the extent of congestion was not measured via the performance measures in the dashboards. The objective of this task is to show the extent of congestion on selected freeways and arterials in the Boston Region MPO area.
Displaying the geographic distribution of congestion can show the extent of congestion; and a visually innovative way to do this is with congestion scans. Congestion scans show how peak periods vary by roadway facility and location, and enable planners or engineers to calculate the amount of congested hours on a roadway facility. The number of congested hours that occurs on a roadway can indicate the cause of congestion at a certain location.
INRIX is a private company that collects and processes vehicle-probe data1. Once data are processed, INRIX sells datasets to government organizations and other transportation entities to use for planning purposes. In 2013, the Boston Region MPO purchased a dataset from INRIX. The dataset contains records that display travel speeds for every minute of 2012 from most roadways in the Boston region, including collector roadways, arterial roadways, and freeways. INRIX data records are provided in one-minute increments for 24 hours per day, 365 days per year. Currently MPO staff use this dataset for the CMP, Long-Range Transportation Plan (LRTP), and the Travel Demand Model.
The CMP committee agreed that CMP staff should create congestion scans for 11 freeway routes and 22 arterial routes. Staff mapped all freeways that are displayed in the Express Highway Performance Dashboard through congestion scans. In addition, staff selected 22 arterial routes that have an average annual daily traffic count of 35,000 or greater as candidates for congestion scans. Most freeway and arterial routes are so long that the routes commonly need to be broken into sections for congestion scan plotting. To achieve a legible geographic display, each individual freeway congestion scan needs to be less than 25 miles long, and each arterial congestion scan needs to be less than 17.5 miles long. Any routes that are longer than the stated limits are partitioned into separate sections for congestion scan plotting.
A congestion scan visually displays congestion based on preset performance-measure thresholds for a corridor for up to 24 hours a day, at multiple locations. Thus, a congestion scan shows the location, intensity, and longevity of congestion within a specific corridor. A congestion scan features an X-axis, which represents the time of day over a 24-hour period, and a Y-axis, which represents the location along a roadway corridor. The typical roadway length of a congestion scan is indicated by mile markers.
For freeways, the Speed Index2-performance metric is used to gauge congestion conditions. This metric is suitable for measuring congestion on freeways as they generally experience uninterrupted traffic flow because of the absence of traffic signals. This allows for a smooth, one-to-one comparison of travel speeds to speed limits over longer Traffic Messaging Channel (TMC) 3 segments.
For arterials, the Travel Time Index4 metric was used to gauge congested conditions, as depicting the true average speed on a TMC is often difficult because of interrupted traffic flow. In addition, in certain areas some arterials have low travel speeds at all times, which may indicate a false positive for congested conditions if the Speed Index is used. A solution to these problems is to compare optimum travel conditions with 24-hour travel conditions to determine the congested locations and to use the Travel Time Index performance measure.
In creating the congestion scans, staff calculated congested hours for each roadway corridor by visually analyzing each scan and recording each time period that experiences congestion. In order for conditions to be considered congested, the Speed Index or Travel Time Index threshold must fail to meet the congestion threshold for a least 15 consecutive minutes, along a roadway segment that is at least a half mile long. The amount of congested hours for each congestion scan corridor is cited in Appendix A.
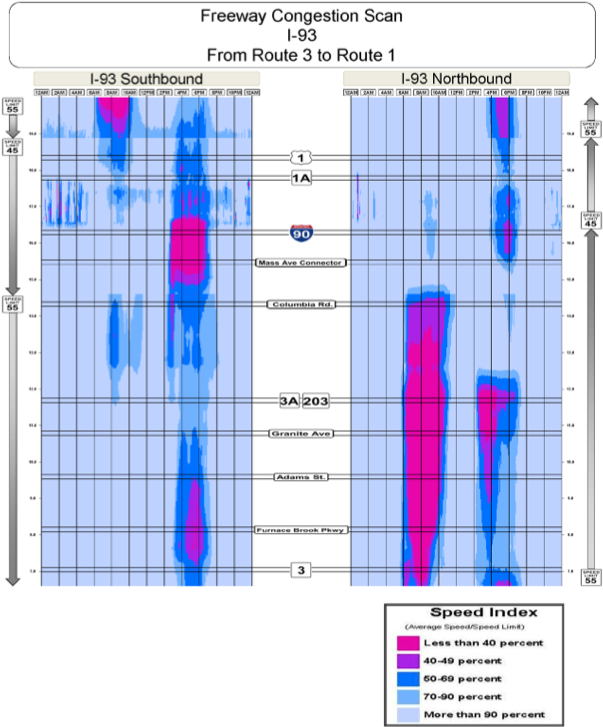
Figure 1 shows an example of a freeway congestion scan (for scans for specific freeways, please refer to Appendix B). Using the Speed Index metric, the congestion scans show the congested times of a typical weekday. The speed limit is displayed beside the congestion scan. Staff analyzed peak-period length by Circumferential Corridor11, as defined by the LRTP Needs Assessment.
Figure 1
Example of Freeway Congestion Scan, Typical Weekday, 2012
Figure 2 shows the average times in the AM peak period that freeways experience congested conditions, by Circumferential Corridor, as defined in the LRTP. The freeways located in the Outer Circumferential Corridor have the shortest AM congested period, lasting 140 minutes. Freeways that are located in the Route 128 Circumferential Corridor have the longest AM congested period, at 195 minutes. The Route 128 Circumferential Corridor’s congested period starts the earliest, at 6:35 AM.
Figure 2
Duration of Congested Conditions on Freeways, Typical Weekday,
by LRTP Circumferential Corridor, AM Peak Period, 2012
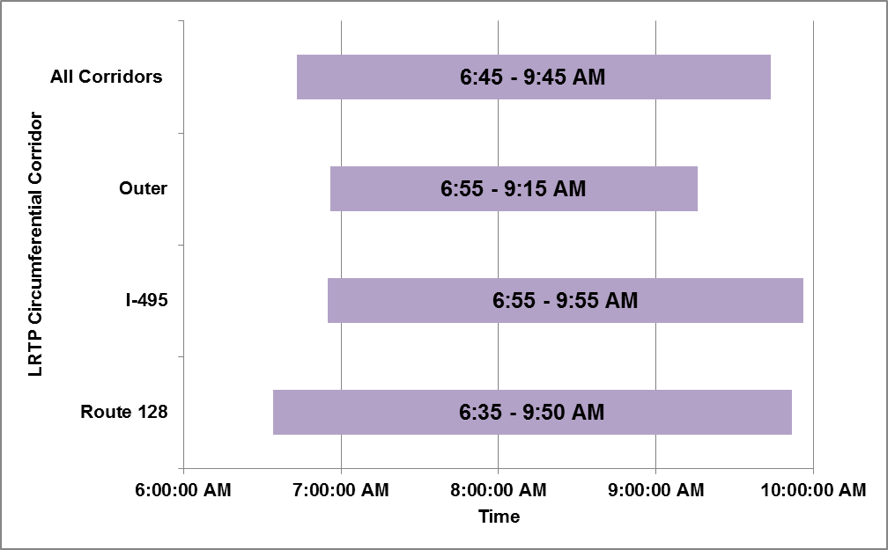
Figure 3 shows the average time in the PM peak period that freeways experience congestion by Circumferential Corridor, as defined in the LRTP. The Outer Circumferential Corridor’s congested period begins the latest, at 4:40 PM. The Outer Circumferential Corridor also has the shortest average congested period on freeways, at 110 minutes; and the Route 128 Circumferential Corridor has the longest congested period, at 195 minutes. For the peak-period start times, end times, and congested hours for each individual congestion scan, please see Appendix A.
Figure 3
Duration of Congested Conditions on Freeways, Typical Weekday,
by LRTP Circumferential Corridor, PM Peak Period, 2012
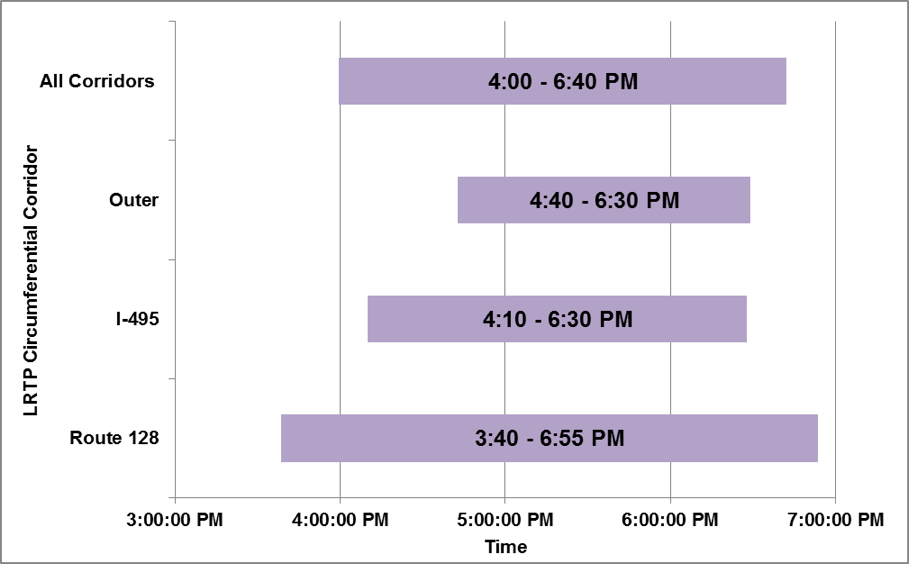
Figure 4 shows the top-ten freeway corridors with the most congested hours during a typical 24-hour weekday. Route 2 eastbound between I-495 and I-95 has 12.1 congested hours. Despite Route 2’s classification as a freeway, this corridor has many features that resemble an arterial, including several traffic signals and a roundabout. I-93 northbound between I-95 and Route 1/Northeast Expressway contains the freeway corridors with the second- and third-greatest congested hours. This portion of I-93 contains several unique bottlenecks including the Braintree Split and the Central Artery Tunnel. The freeway also features a reversible high-occupancy vehicle (HOV) lane, which is active only between 6:00 and 10:00 AM. Four of the top-ten corridors for congested hours are connected directly to the Central Artery Tunnel.
Figure 4
Freeway Corridors with Greatest Congested Hours per Weekday,
by Travel Direction, 2012
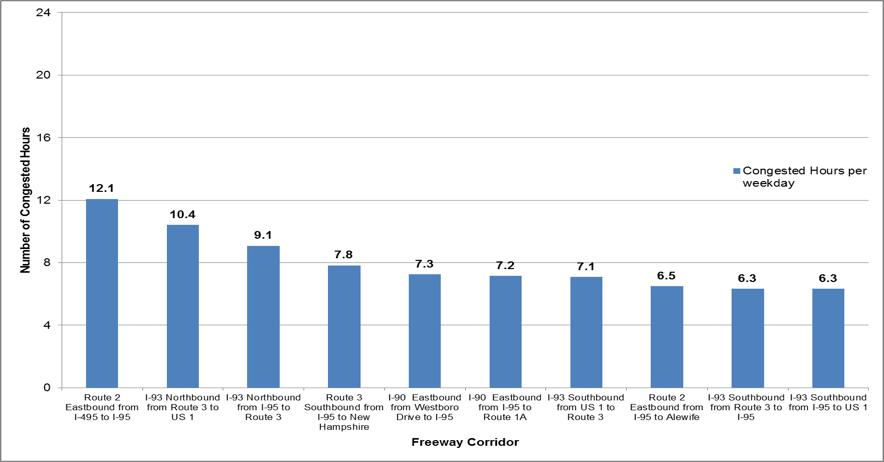
Figure 5 shows an example of an arterial congestion scan (for scans for specific arterials, please see Appendix C). In order to show less distortion, staff made some adjustments. First, Travel Time Index was used to determine congested conditions instead of Speed Index. Therefore, speed limits were not displayed on arterial congestion scans. Second, center TMCs were removed from the congestion scans in order to smooth out the granularity of the visuals. The locations of signal signs, roundabout signs, or railroad signs are displayed to indicate a controlled intersection. Peak-period length was analyzed by Circumferential Corridor, as defined by the LRTP Needs Assessment. Please see Appendix D for a reference map of the Circumferential Corridors.
Figure 5
Example Arterial Congestion Scan, Typical Weekday, 2012
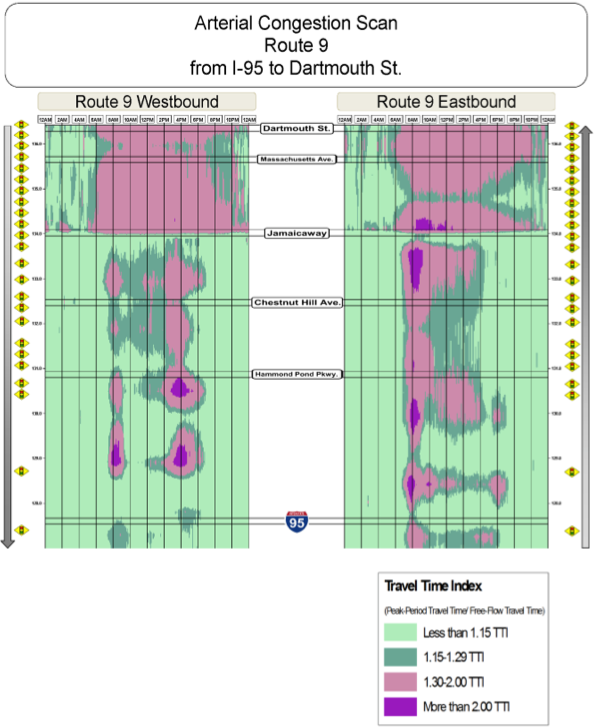
Figure 6 shows the average time in the AM peak period that arterials experience congested congestions, by Circumferential Corridor, as defined in the LRTP. The I-495 Circumferential Corridor has the shortest period of congested conditions, at 165 minutes. The Central Area Circumferential Corridor has the longest congested period, at 250 minutes.
Figure 6
Duration of Congested Conditions on Arterials, Typical Weekday,
by LRTP Circumferential Corridor, AM Peak Period, 2012
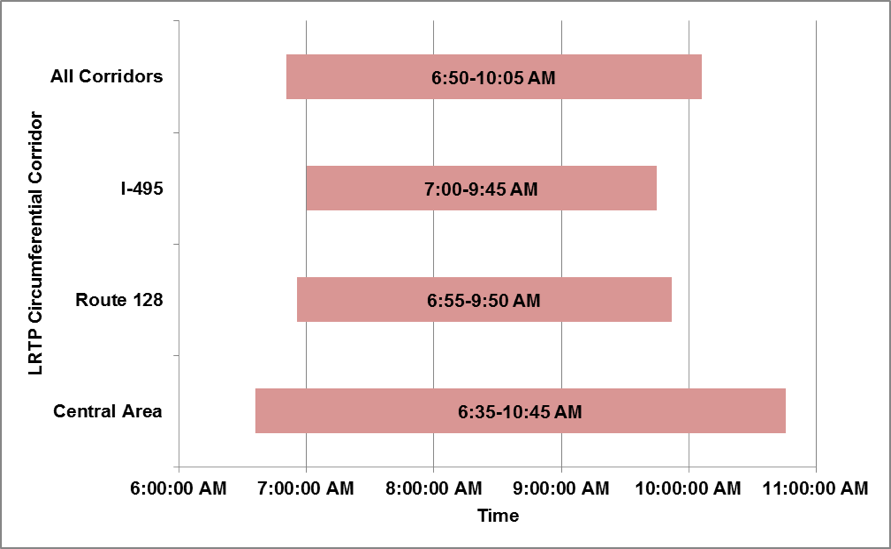
Figure 7 shows the average time in the PM peak period that arterials experience congested congestions, by Circumferential Corridor, as defined in the LRTP. The Route 128 Circumferential Corridor has the shortest congested period, at 195 minutes. The Central Area Circumferential Corridor has the longest congested period, at 255 minutes. For all arterial corridors, the congested periods begin between 2:00 and 3:00 PM. For arterial corridors, congested periods begin earlier than in freeway corridors because the arterials contain many elementary and high schools that dismiss students between 2:00 and 4:00 PM. For the peak-period start times, end times, and congested hours for each individual congestion scan, please see Appendix A.
Figure 7
Duration of Congested Conditions on Arterials, Typical Weekday,
by LRTP Circumferential Corridor, PM Peak Period, 2012
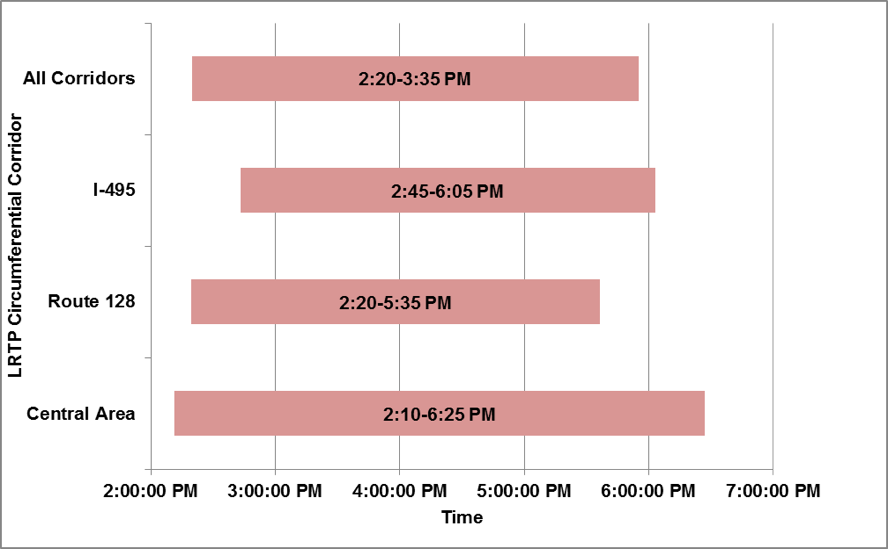
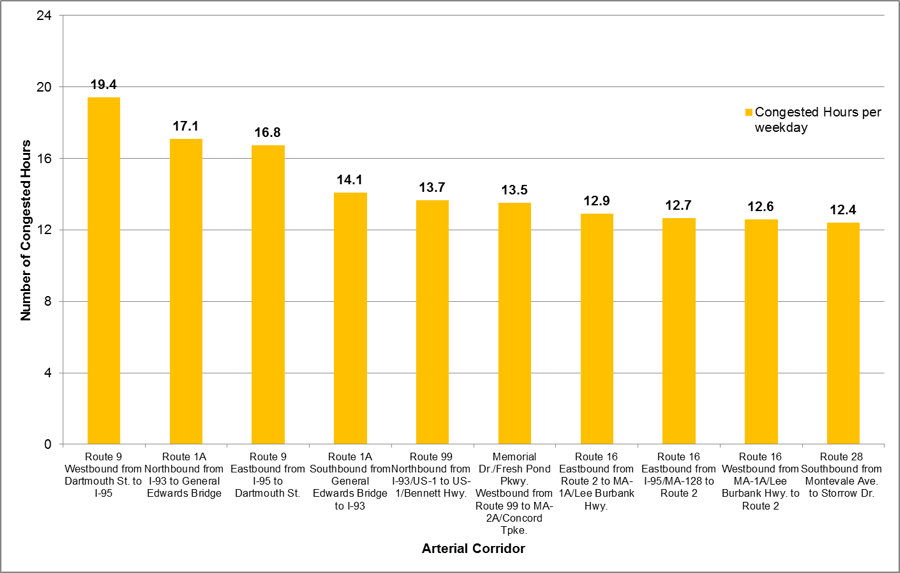
Figure 8 lists the ten arterial corridors with the greatest congested hours per weekday. Route 9 in both directions between I-95 and Dartmouth Street has 19.4 (westbound) and 16.8 (eastbound) congested hours per peak-period weekday. This corridor features more than 20 signals and has a streetcar (the MBTA E branch on the Green line) that runs along the median between Jamaicaway and Massachusetts Avenue. Route 1A between I-93 and the General Edwards Bridge has the second-most congested hours among arterials. This corridor contains the Sumner tunnel, which connects downtown Boston with Boston Logan Airport.
Figure 8
Arterial Corridors with Greatest Amount of Congested Hours
per Weekday, by Travel Direction, 2012
RH/rh
1 Vehicle-probe data are speed or travel time statistics that are collected in bulk from vehicle fleets (contractors) or individual travelers (volunteers) whose vehicles are equipped with global positioning system (GPS) tracking devices. The data then are averaged for a certain time period by private vendors and are made available to transportation entities for purchase.
2 The Speed Index indicates congestion more accurately than travel speed alone because low travel speed may be a result of low speed limits on certain facilities. Speed Index = average speed / posted speed limit.
3 The Traffic Messaging Channel location code is a common industry convention developed and maintained by the leading electronic map database vendors to define road segments uniquely. For freeways, a TMC location is defined as the segment between two interchanges. Often, the TMC segment definition varies for arterial roadways.
4 The Travel Time Index directly compares travel time conditions at a particular time with free-flow travel time conditions. Travel Time Index indicates how much contingency time should be considered to ensure an on-time arrival during a certain time versus optimum travel times. Travel Time Index = average travel time at a particular time / free-flow travel time.
5 Center TMC locations are indicated by either a “P” or an “N” in the TMC code. Center TMC locations represent a roadway segment that is located at an interchange or intersection. “P” stands for positive directionality and “N” stands for negative directionality. Center TMC locations that have a “P” in their codes are aligned in either a northbound or an eastbound direction. TMC locations that have an “N” in their codes are aligned in either a southbound or a westbound direction. Non-center TMCs are indicated by a “+” or a “-” in the TMC code: a “+” stands for positive directionality and a “-” stands for negative directionality. Non-center TMC locations typically represent a roadway segment that aligns between interchanges or intersections. Non-center TMC locations that have a “+” in their codes are aligned in either a northbound or an eastbound direction. Non-center TMC locations that have a “-” in their codes are aligned in either a southbound or a westbound direction.
6 The confidence score is a metric that INRIX uses to indicate the source of a data record. The confidence score ranges from 10 to 30. A confidence score of 30 indicates that the data are collected in real time. A confidence score of 20 indicates that the data are both real time and historical. A confidence score of 10 indicates that the data source is exclusively historical.
7 A minimum confidence score requirement of 30 was determined by MPO staff because of the preference to use exclusively real-time collected data for the CMP.
8 The C-value is a metric that INRIX uses to indicate the reliability of a data record. C-values for data records range from 0 to 100. A low C-value indicates that there may have been a sudden change in speed at a particular location, usually caused by an incident.
9 The threshold of 75, as decided by MPO staff, was an optimal number where data records that are extreme outliers would be excluded, but all TMCs still would be able to retain a statistically valid sample size.
10 The Boston Region MPO definition of free-flow speed and free-flow travel time are calculated using the 85th percentile speed of all records from each respective dataset between 12:00 AM and 2:00 AM (instead of during the AM and PM peak periods).
11Please refer to Figure D.1, in Appendix D, for a detailed map of the LRTP Circumferential Corridor. The Outer corridor consists of any municipality that is outside of the Boston Region MPO area. The I-495 corridor encompasses the far west portion of the MPO region, near I-495. The Route 128 corridor is represented as a ring, which includes I-95/Route 128. The Central Area Circumferential Corridor consists of Boston and its inner-ring suburbs.